Fig. 4.

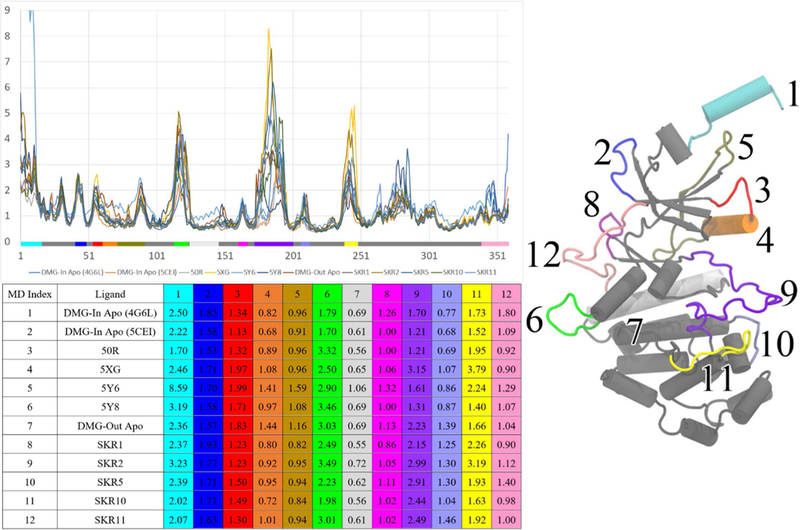
RMSF for all the studied CDK8/CycC systems. The color bar on the x-axis marks the regions of CDK8. The table beneath the plot lists the 12 regions with large motions and highlighted with colors that correspond to the color bar

RMSF for all the studied CDK8/CycC systems. The color bar on the x-axis marks the regions of CDK8. The table beneath the plot lists the 12 regions with large motions and highlighted with colors that correspond to the color bar