Fig. 8.

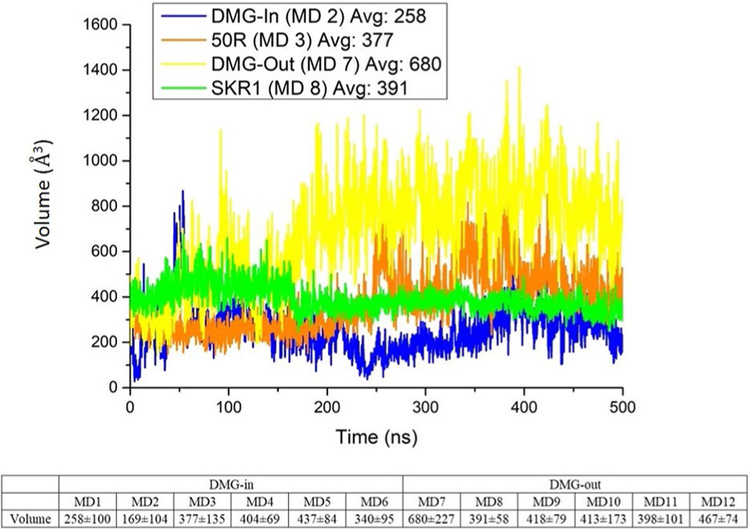
Volumes of the ATP binding site in Å3. Plot: Volume change along the MD time for four selected systems; Table: average volumes with standard deviations of all 12 MD systems

Volumes of the ATP binding site in Å3. Plot: Volume change along the MD time for four selected systems; Table: average volumes with standard deviations of all 12 MD systems