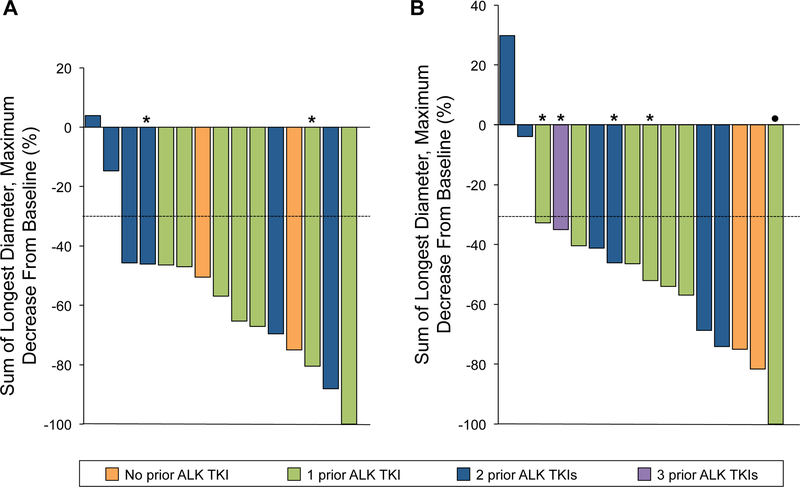
Figure 1.
Tumor responses to alectinib. (A) Maximal percent change in target intracranial lesions from baseline in patients with measurable CNS disease. (B) Maximal percent change in target lesions from baseline in patients with measurable overall disease. Patients unevaluable for response or with nonmeasurable disease are not shown. Dotted horizontal line shows the 30% threshold for partial response (PR). Asterisk indicates stable disease. Dot indicates PR.

