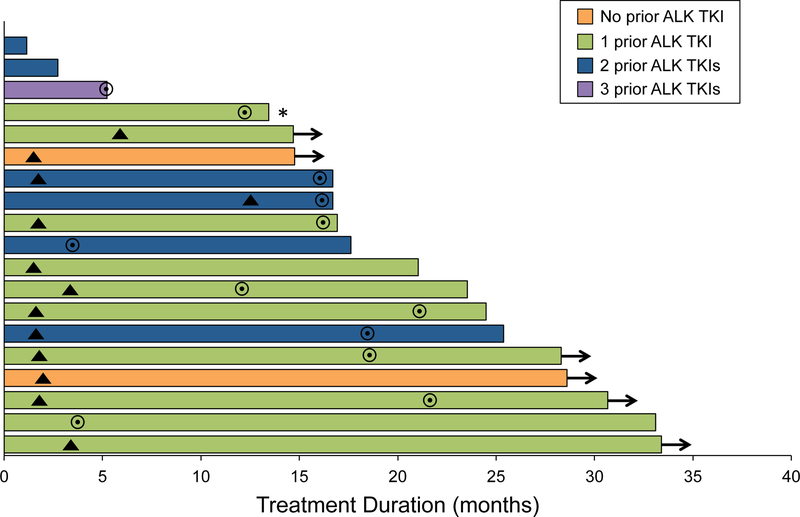
Figure 3.
Duration of treatment. Arrows indicate patients continuing on alectinib at data cutoff. Triangles indicate the time points at which a CNS response was first observed. Circles represent the time points of CNS disease progression. Asterisk indicates a patient whose disease was unevaluable for CNS response.

