
Figure 5: Evidence of Neuronal Sensitization with RSD.
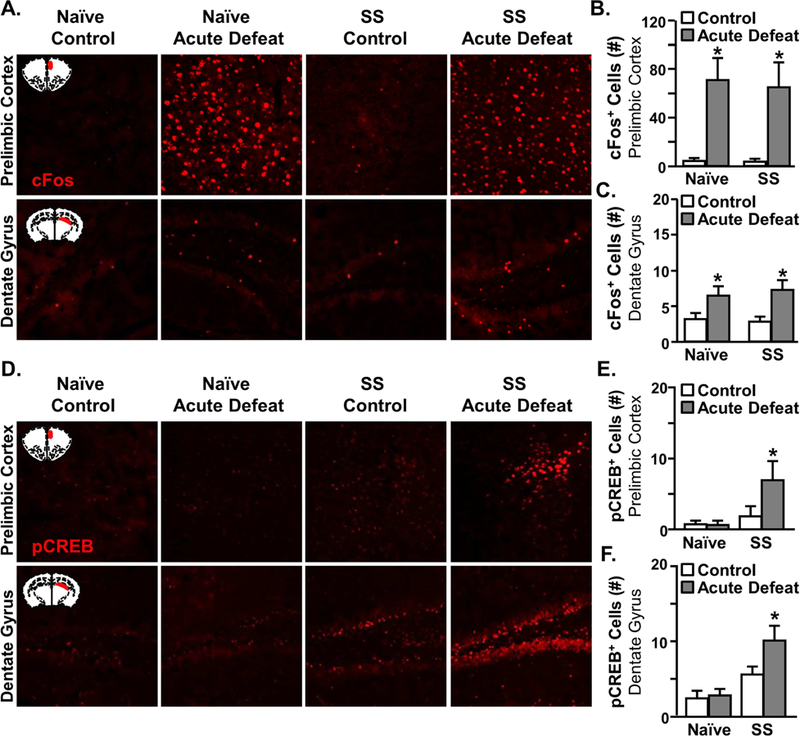
Male C57BL/6 mice were stress-sensitized (SS) by RSD or left undisturbed as controls (Naϊve). At 24 d after stress, all mice were exposed to one cycle of social defeat (acute defeat). Immediately after acute defeat, brains were perfused, fixed, sectioned, and labeled for c-Fos or pCREB (n=6). A) Representative images of c-Fos expression in the prelimbic cortex (top panel) and dentate gyrus (bottom panel). The number of c-Fos+ cells in the B) prelimbic cortex (F1,23=27.6,p<0.001) and C) dentate gyrus of the hippocampus in control and SS mice 14 h after acute defeat (F1,23=75.8,p<0.001). D) Representative images of pCREB expression in the prelimbic cortex (top panel) and dentate gyrus (bottom panel). Number of pCREB+ cells in the E) prelimbic cortex (SS, F1,24=4.7 p<0.04), SS x acute stress interaction (F1,24=2.9, p=0.1) and F) dentate gyrus of control and SS mice 0.5 d after acute defeat (SS, F1,24=17.7, p<0.001). Bars represent the mean ± SEM. Means with (*) are significantly different from Control-Naïve (p<0.05).