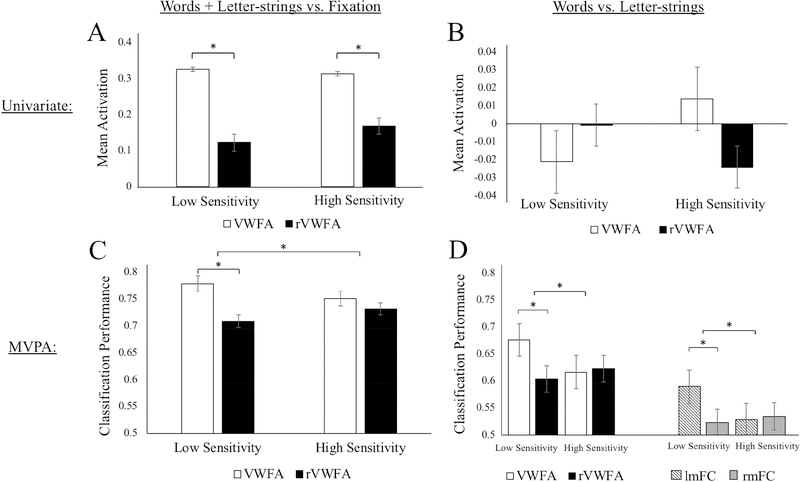
Figure 3.
Mean activation and classification performance for groups with lower, and higher, sensitivity to visual-spatial distortion. The left column (A and C) shows results for words and letter-strings compared to fixation (in univariate localized ROIs). Panel A shows activation levels for words and letter-strings > fixation in each hemisphere. Panel C shows decoding of words and letter-strings versus fixation. Note that the result-of-interest is lateralization (differences between white and black bars), which is orthogonal to ROI selection. The right column (B and D) shows results from the more specific words versus letter-strings contrast (in MVPA localized ROIs). Panel B shows activation levels for words > letter-strings. Panel D shows classification of words versus letter-strings (chance = 0.5) in VWFA and mid-fusiform cortex (following PCA). The significance bar across groups in C and D indicate interactions between hemisphere and inversion group. Error bars show the standard error of the mean.

