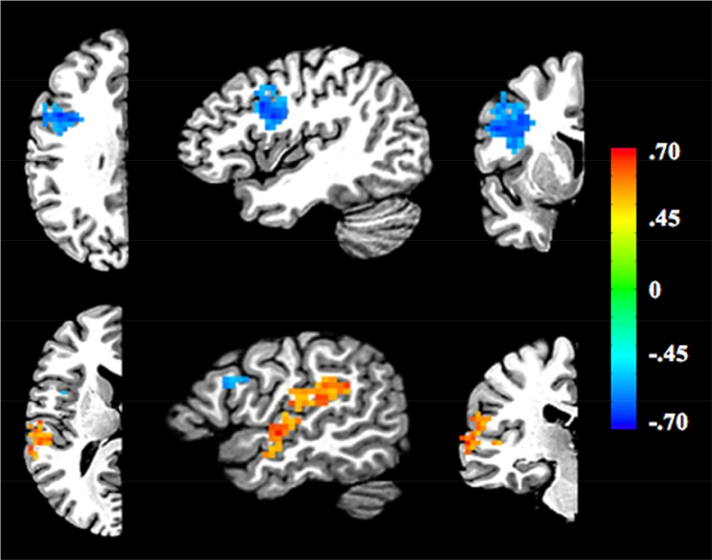
Figure 5.
Results of exploratory lateralization searchlight approach correlating lateralization differences with each person’s inversion sensitivity scores. Location of two clusters were detected above the corrected threshold, one near the junction of the inferior frontal and precentral sulci (IFJ) and superior temporal gyrus (STG). Attention only needs to be given to one half of the brain because of the left - right subtraction employed (i.e., the opposite hemisphere is a reverse mirror image). The blue cluster represents a negative correlation between lateralization differences and inversion sensitivity scores. The red cluster represents a positive correlation between lateralization differences and inversion sensitivity scores. Top row: x = −41, y = 4, z = 29. Bottom row: x = −51, y = 23, z = 13. The different colors on the scale represent r-values.

