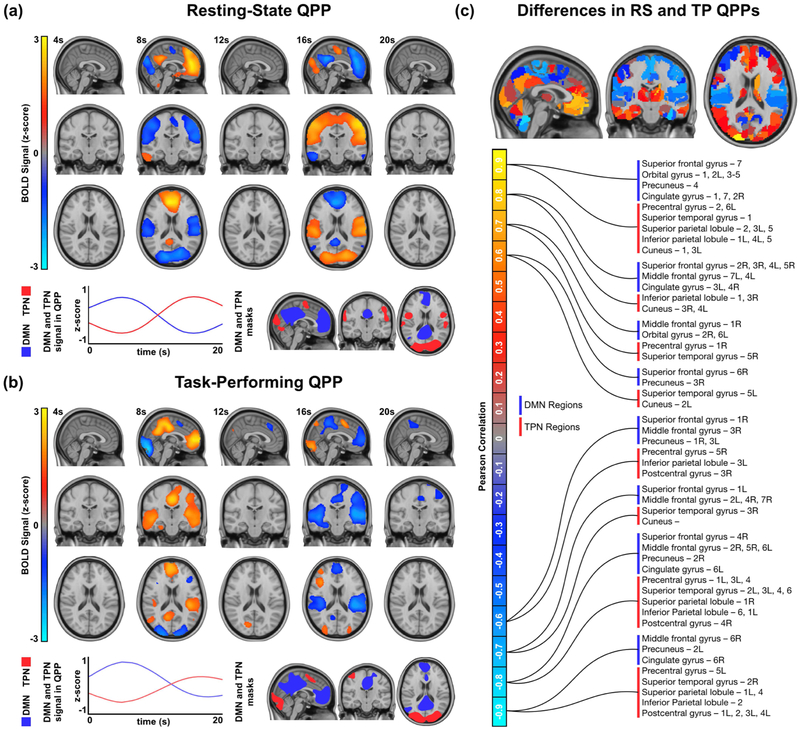
Figure 1:
Quasi-periodic patterns in resting-state and task-performing groups. (a) Top: Spatiotemporal pattern seen in the resting-state QPP. Only BOLD signal changes 1.5x the standard deviation from the mean are shown. Bottom-left: DMN and TPN timecourse during the resting-state QPP. Bottom-right: Maps of DMN and TPN acquired from resting-state individuals. (b) Top: Spatiotemporal pattern seen in the task-performing QPP. Only BOLD signal changes 1.5x the standard deviation from the mean are shown. Bottom-left: DMN and TPN timecourses during the task-performing QPP. Bottom-right: Maps of DMN and TPN acquired from task-performing individuals. (c) Top: Spatiotemporal differences between the resting-state and task-performing QPPs. Bottom: Regions in the DMN and TPN that showed strong similarity between groups (> 0.6 Pearson correlation, shown in red/yellow) and strong dissimilarity between groups (< −0.6 Pearson correlation, shown in blue/turquoise). A full list of these regions can be found in Supplementary Table 1.

