Figure 2:
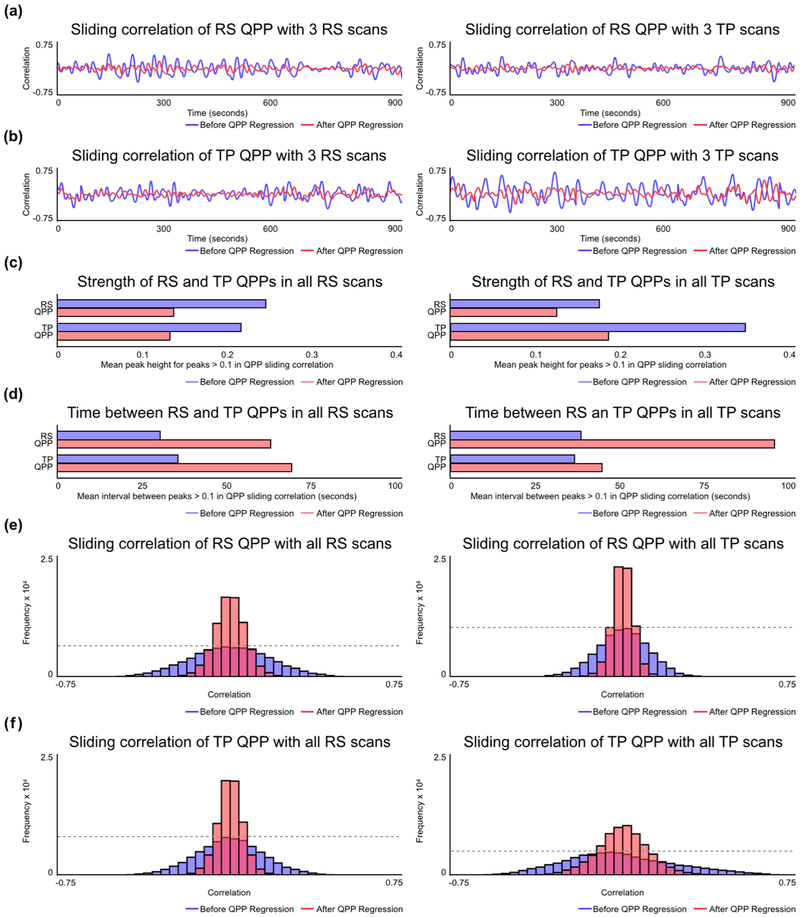
Strength and frequency of QPPs in resting-state and task-performing groups. (a) Example sliding correlation of the resting-state QPP with three concatenated scans from unique individuals during rest (left) and the same scans during task (right) before QPP regression (blue) and after QPP regression (red). (b) Example sliding correlation of the task-performing QPP with three concatenated scans from unique individuals during rest (left) and the same scans during task (right) before QPP regression (blue) and after QPP regression (red). (c) Mean correlation strength of peaks > 0.1 in the cumulative sliding correlation of the resting-state and task-performing QPPs with all resting-state scans (left) and all task-performing scans (right) before QPP regression (blue) and after QPP regression (red). (d) Mean time interval between peaks with correlation strength > 0.1 in the cumulative sliding correlation of the resting-state and task-performing QPPs with all resting-state scans (left) and all task-performing scans (right) before QPP regression (blue) and after QPP regression (red). (e) Histogram of the cumulative sliding correlation of the resting-state QPP with all resting-state scans (left) and all task-performing scans (right) before QPP regression (blue) and after QPP regression (red). (f) Histogram of the cumulative sliding correlation of the task-performing QPP with all resting-state scans (left) and all task-performing scans (right) before QPP regression (blue) and after QPP regression (red).

