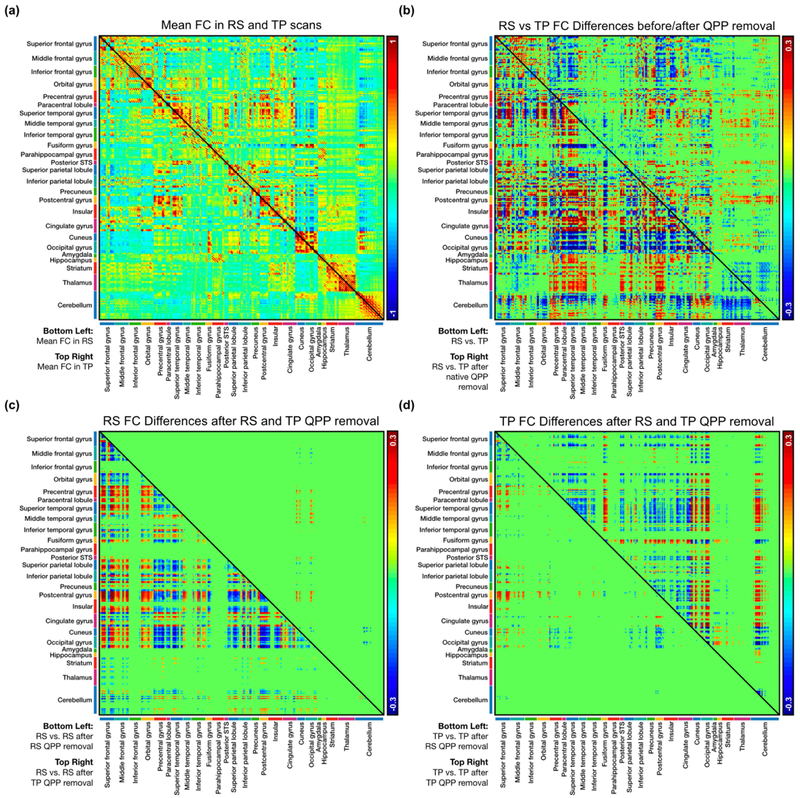
Figure 3:
Functional connectivity (FC) in 273 regions of interest. (a) Bottom-left: Mean FC in the resting-state group. Top-right: Mean FC in the task-performing group. (b) Bottom-left: Significant differences in FC between the resting-state and task-performing group (n = 17,156). Top-right: Significant differences in FC between the resting-state and task-performing group after regression of their native QPPs (n = 10,259). (c) Bottom-left: Significant differences in FC in the resting-state group after regression of the resting-state QPP (n = 8,662). Top-right: Significant differences in FC in the resting-state group after regression of the task-performing QPP (n = 188). (d) Bottom-left: Significant differences in FC in the task-performing group after regression of the resting-state QPP (n = 1,062).

