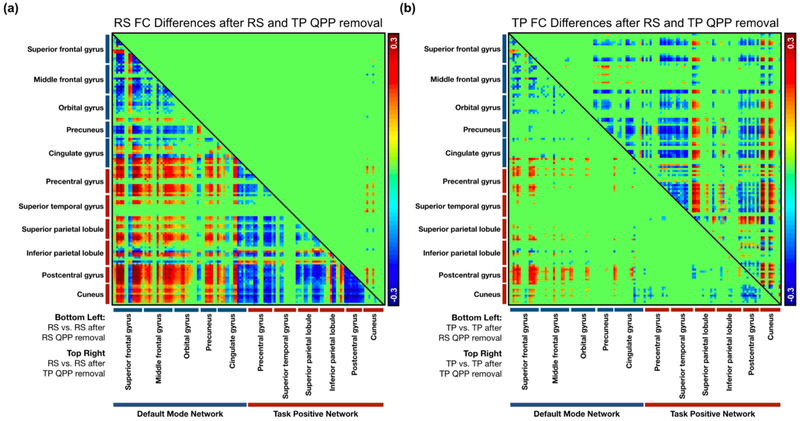
Figure 4:
Significant functional connectivity changes in regions within the DMN and TPN after regression of QPPs. (a) Bottom-left: Significant differences in FC in the resting-state group after regression of the resting-state QPP. Top-right: Significant differences in FC in the resting-state group after regression of the task-performing QPP. (b) Bottom-left: Significant differences in FC in the task-performing group after regression of the resting-state QPP. Top-right: Significant differences in FC in the task-performing group after regression of the task-performing QPP.
Top-right: Significant differences in FC in the task-performing group after regression of the task-performing QPP (n = 5,756).

