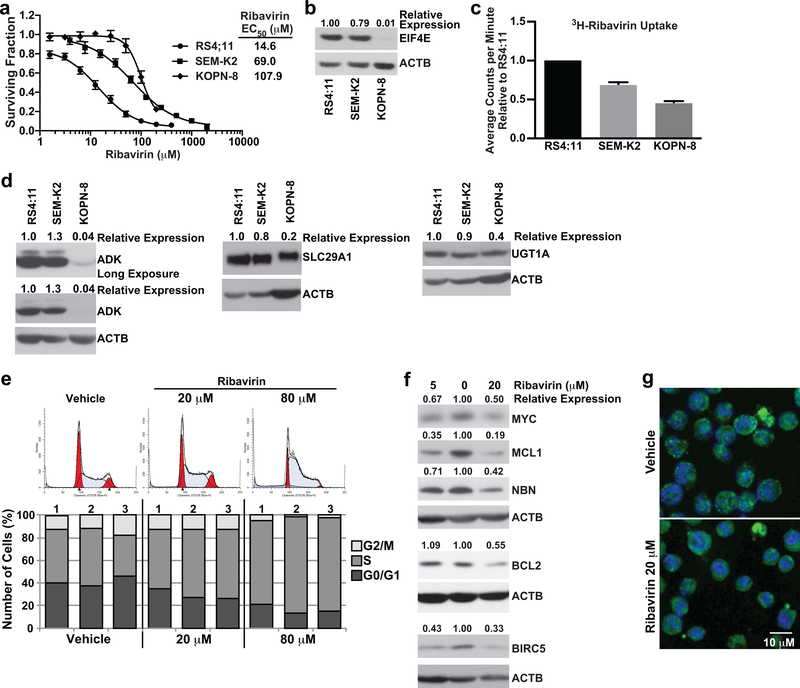
Figure 5. Determinants of single-agent ribavirin activity in KMT2A-R ALL cell lines and functional effects of ribavirin on RS4:11 cells.
(a) MTT assay data represented as surviving fraction plots after treatment of KMT2A-R cell lines × 72 h with increasing ribavirin concentrations. Plots are mean values from 10 experiments for RS4:11, 8 experiments for SEM-K2 and 3 experiments for KOPN-8 cells. Each experiment included 3–6 replicates/condition. Error bars show standard error. Note lower ribavirin EC50 within clinically relevant concentrations for RS4:11 cells.
(b) Western blot showing correlation between ribavirin sensitivity (lower EC50) and high-level basal EIF4E expression. EIF4E levels normalized to ACTB and then made relative to RS4:11 are shown at top of blot. The blot is representative of data reproduced in 3 separate experiments. Note that the most ribavirin-sensitive cell line RS4:11 expresses the most EIF4E and KOPN-8 with highest EC50 has the least EIF4E expression.
(c) Bar graph of relative 3H-ribavirin uptake after 8 h treatment of KMT2A-R cell lines with 3H-ribavirin (RS4:11 cell line set to 1). Note that KOPN-8 with highest EC50 has the lowest uptake, and RS4:11 with lowest EC50 has the highest uptake (c.f. Figure 5a). Experiment performed twice with 3 intra-experimental replicates per experiment. Black bars indicate standard deviation.
(d) Western blot analysis of basal expression of ADK, SLC29A1 and UGT1A proteins. Band intensities for each protein normalized to ACTB and then made relative to RS4:11 cells are at top of blots. Blots are representative of two independent experiments. Note similar expression of ADK, SLC29A1 and UGT1A in RS4:11 cells compared to SEM-K2 cells, and lower expression of all three proteins in KOPN-8 cells.
(e) Analysis of cell cycle in ribavirin-treated RS4:11 cells. Representative flow cytometric analysis of propidium iodide labeling showing modeled cell cycle distribution after treatment × 24 h with vehicle or ribavirin at indicated concentrations (top). The histogram is representative of 3 separate experiments. Bar graphs (bottom) show percentages of cells in G0/G1, S, and G2/M in the 3 experiments. Note dose-dependent increase in cells in S phase indicative of cell cycle arrest with ribavirin treatment.
(f) Western blot analysis of EIF4E targets in ribavirin-treated RS4:11 cells. Cells were treated for 72 h with vehicle or ribavirin at 5 μM and 20 μM. Vehicle-treated cells are in center lanes. Band intensities normalized to ACTB and then made relative to vehicle for each protein are at top of blots. Experiments were done 3–5 times except BCL2 and BIRC5 done twice for 5 μM ribavirin. The blots show down-regulation of MYC, MCL1, NBN, BCL2 and BIRC5.
(g) Change in EIF4E subcellular distribution in ribavirin-treated RS4:11 cells. Confocal images show nuclear to cytoplasmic shift in most cells in population after 72 h ribavirin treatment compared to the nuclear EIF4E location in most cells following vehicle treatment. DAPI labeled DNA in the nucleus is blue and EIF4E labeled with anti-eIF4E-FITC is green. The images are representative of 3 separate experiments.

