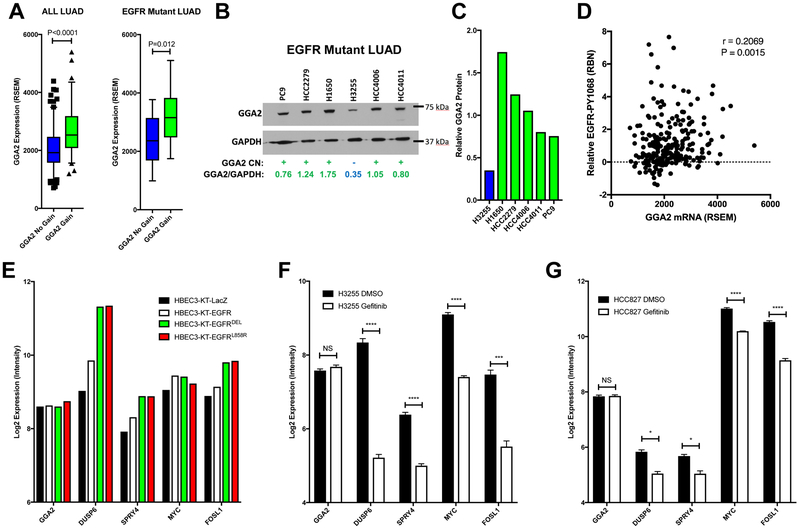
Figure 3. GGA2 expression is driven by copy number gain in EGFRMUT lung adenocarcinomas.
(A) GGA2 expression is increased in tumors with copy number increased compared to those without. LAC tumors from the TCGA dataset were separated by their GGA2 copy number status and the expression of GGA2 compared between tumors with gain/amplification (green) and those without (blue) using a Mann-Whitney U-Test. Resulting box plots and p-values are provided for all LUAD (left) and only EGFRMUT LAC (right). As we predicted that GGA2 would be higher in cases with copy number increase, a one-tailed p-value was used. (B) GGA2 western blot for LAC cell lines. GGA2 copy number status for each line was defined based on our previous publication. Cell lines with GGA2 gain (+) are indicated in green and those without (−) are indicated in blue. Relative protein levels of GGA2 vs GAPDH were determined by dosimetry and are indicated for each cell line. (C) The relative GGA2 protein expression from (B) is plotted for the same cell lines. LACs with GGA2 gain have higher expression of GGA2 protein than those without. (D) GGA2 mRNA expression correlates with higher phospho-EGFR in LAC. GGA2 mRNA level (RSEM, x-axis) from RNA-Seq and EGFR-PY1068 level (RBN, y-axis) from RPPA are plotted and the resulting Spearman’s correlation coefficient and p-value are indicated revealing a significant positive association as predicted based on the association of GGA2 gain with EGFR mutation. (E) GGA2 expression is not driven by EGFR signaling. The expression of GGA2 and known EGFR regulated genes (DUSP6, SPRY4, MYC and FOSL1) are plotted for HBECs containing control (LacZ), EGFRWT (EGFR) and EGFRMUT (EGFRDEL and EGFRL858R) expression constructs. GGA2 levels do not change upon EGFR activation while known targets increase. (F-G) GGA2 expression is driven independent of EGFR signaling in LAC. Expression for the same genes in (E) are plotted in EGFRMUT LAC (H3255, F and HCC827, G) cell lines treated with the EGFR TKI gefitinib. GGA2 remains the same across all states in both cell lines whereas the known EGFR targets decrease upon receptor inhibition. *p<0.05, **p<0.01, ***p<0.001 and ****p<0.0001, two tailed unpaired t-test.

