Fig. 2.
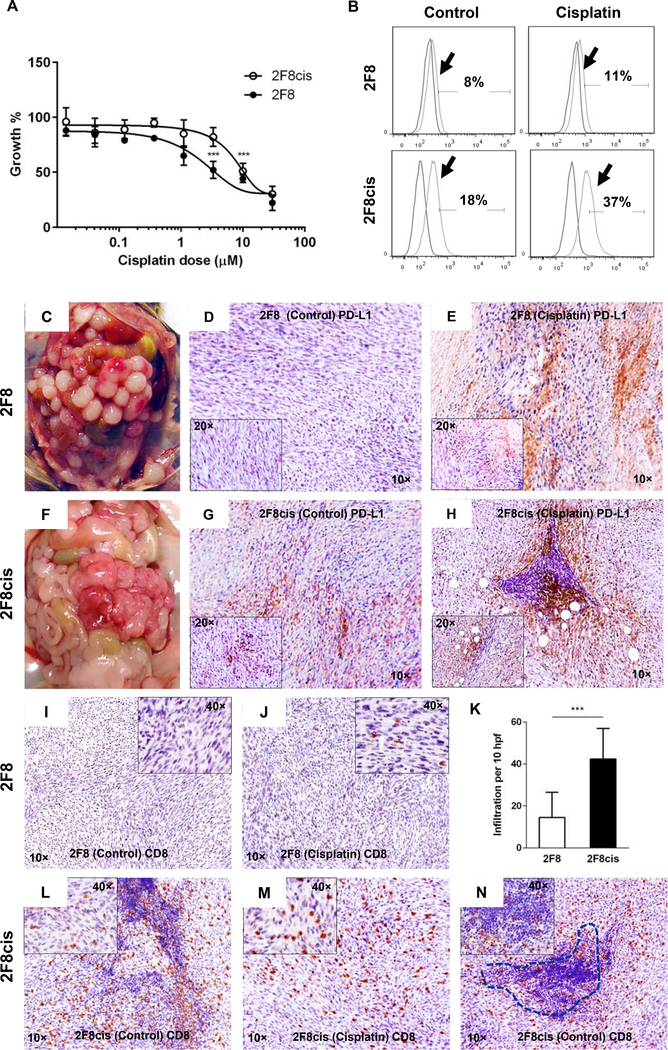
(A) Dose response curves of mouse 2F8 (black circles) and 2F8cis cells ( open circles) treated with cisplatin for 48 h. (B) Flow cytometry showing histograms for PD-L1 expression (arrows) in 2F8 (top) and 2F8cis cells (bottom). Isotype control curves were used for gating. Percentages represent PDL1 positive cells. (C, F) Intraperitoneal tumor challenge with 2F8 (C) and 2F8cis cells (F) leads to extensive peritoneal carcinomatosis. (D, G, E, H) Tissue PD-L1 expression detected by IHC in untreated 2F8 (D) and 2F8cis tumors (G) and after cisplatin treatment (E and H, respectively). Images were acquired at 10x; insets in D and E represent images at 20x. (I-N) IHC dentification of CD8 T cells in 2F8 (I, J) and 2F8cis tumors (L-N) via IHC, before (I, L) and after cisplatin treatment (J, M). (K) Average CD8 T cell counts per 10 high power fields (hpf) and SD, in 2F8 and 2F8cis tumors. P<0.001 Student t test. (N) CD8 T cells inside the tumor mass and within a tertiary lymphoid-like structure (dotted line) in a representative 2F8cis tumor.

