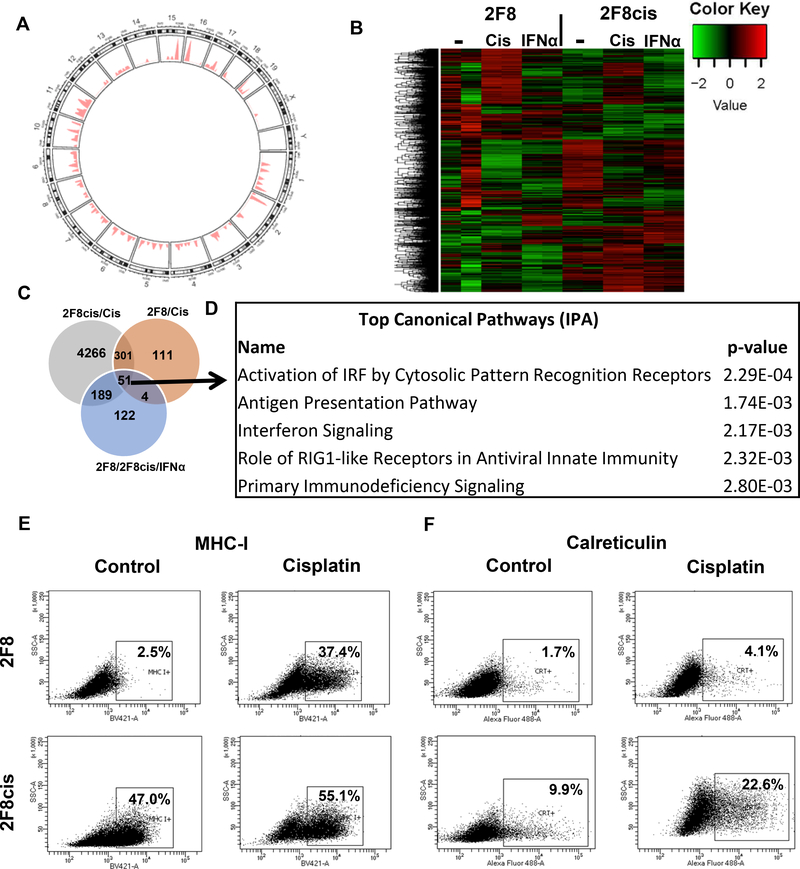
Fig. 3.
(A) Somatic point mutations (n=202) identified in 2F8cis cells, using 2F8 cells as reference. The genome-wide distribution of mutations is shown in a circos plot. The chromosomes are numbered and arranged in a circular orientation. The x-axis corresponds to the genomic regions by chromosome, the y-axis corresponds to the density/frequency of mutations in each chromosome. (B) Heat map of DE genes (n= 4074 selected genes, with greater than Q3 expression level and greater than Q3 variance) in 2F8 and 2F8cis cells, either untreated (−), exposed to cisplatin (cis) or IFNα. Samples were run in duplicate. (C) Venn diagram of DE genes. Grey circle represents DE genes upregulated by cisplatin treatment in 2F8cis cells compared to control treated. Brown circle represents the DE genes upregulated by cisplatin treatment in 2F8 cells, compared to control cells. Light blue circle represents DE genes commonly upregulated by IFNα in both 2F8 and 2F8cis cells.All genes are listed in Supplementary Table 2 (q<0.05) (D) Top 5 pathways identified via Ingenuity Pathway Analysis, using the common DE genes from the three-circle intersection (n=51 genes, listed in Suppl. Table 2). (E, F) MHC I (E) and calreticulin (F) detection via flow cytometry of 2F8 (top) and 2F8cis cells (bottom), either untreated (ctr) or exposed to IC50 cisplatin for 48 h. Percentages represent positive cells, using isotype control for gating. Results of at least three independent experiments are shown.

