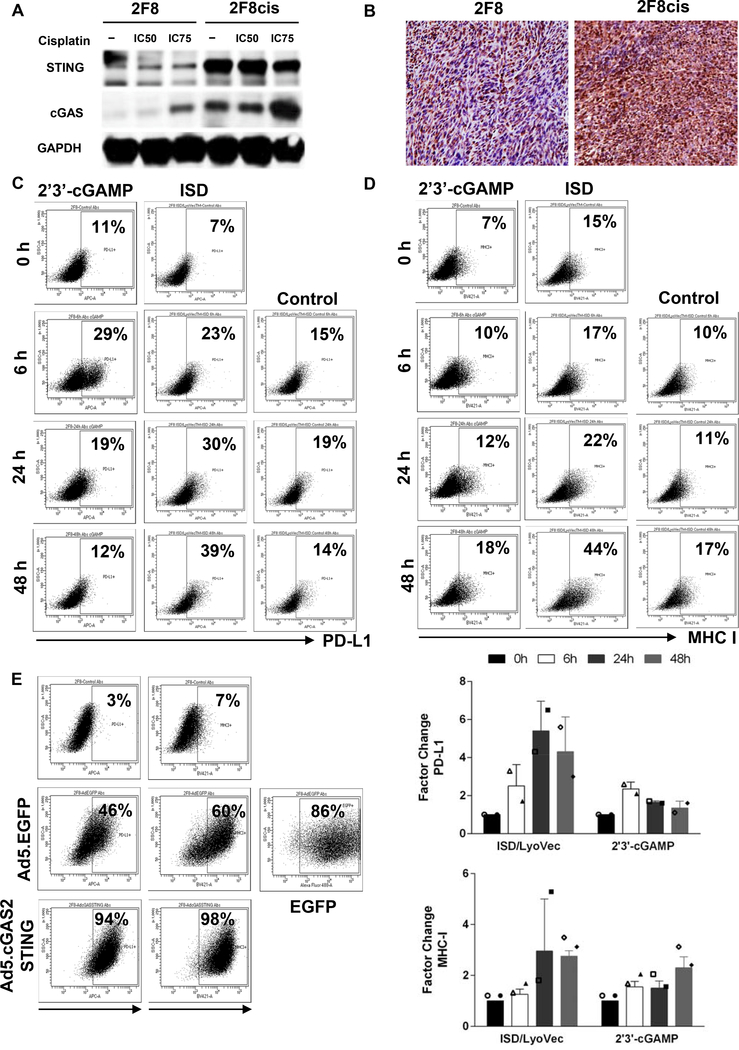
Fig. 4.
(A) Detection of cGAS and STING proteins by Western blot, using lysates from 2F8 and 2F8cis cells either untreated (−) or exposed to IC50 and IC75 cisplatin. GAPDH was used as loading control. (B) Detection of STING protein by IHC, in 2F8 (left) and 2F8cis tumors (right). (C, D) PD-L1 (C) and MHC I (D) detected by flow cytometry, following exposure of 2F8 cells to STING ligand 2’3’-cGAMP and ISD oligomer. Control indicates treatment with a non-immunostimulatory single-stranded oligonucleotide. (E) PD-L1 and MHC I expression detected by flow cytometry in 2F8 cells transduced with adenovirus encoding for cGAS/STING (Ad5.cGAS2ASTING) for 48 hours. Untreated and control adenovirus (Ad5.EGFP) treated cells are shown as reference. Percentages represent positive cells. Gates were set up based on staining with isotype control antibodies for each respective marker. EGFP positive cells indicate transfection efficiency. (F). Average expression of PD-L1(top) and MHC I (bottom) detected by flow cytometry in 2F8 cells following exposure to STING ligand 2’3’-cGAMP and ISD oligomer. Factor change represents the ratio of percent positive cells in the treatment group to control.The symbols represent measurements from separate experiments.

