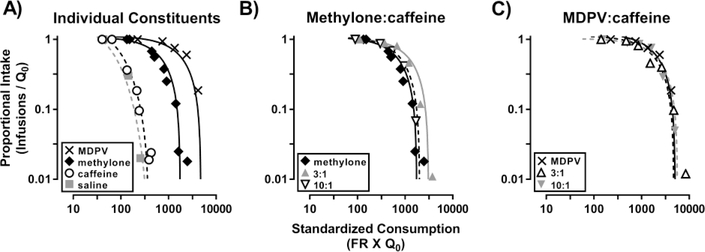
Figure 2:
Demand curve analyses of self-administration data obtained during 2-hr sessions in which the FR response requirement was increased across sessions. Abscissa: standardized price of each drug presented on a log scale. Left ordinate: proportional consumption expressed on a log scale. Note: the data presented are from only the rats (n=8) that responded for all of the drugs/drug mixtures shown.

