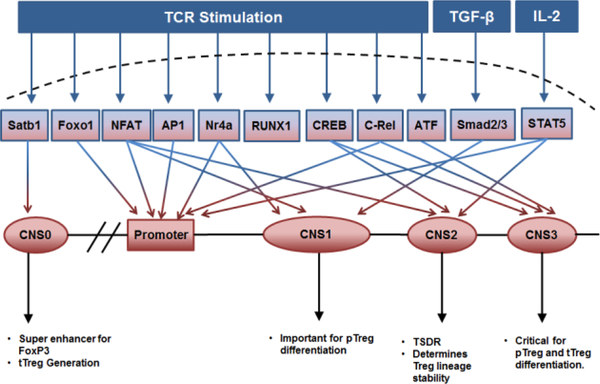
Figure-1:
Schematic diagram of transcriptional and epigenetic regulation of Foxp3 expression. Inducers of various transcription factors and respective transcription factor binding sites in the Foxp3 promoter and enhancer regions like CNS1, CNS2, and CNS3 are indicated using arrowheads. Effect of corresponding regions on tTreg and pTreg differentiation and function are also indicated.

