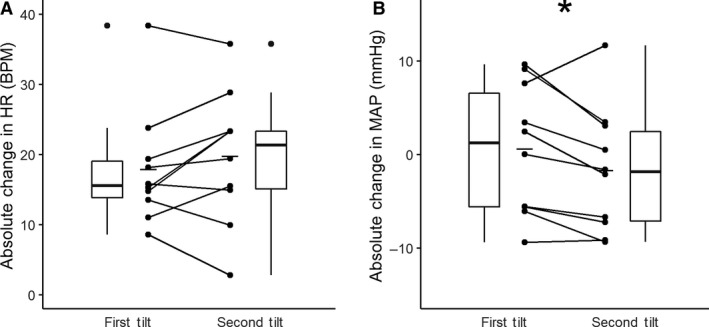
Figure 1.

Tilt order. There were no statistical differences in the absolute change in heart rate (HR) (P = 0.267, paired Students t‐test). Absolute change in mean arterial pressure (MAP) from baseline decreased and became negative during the second tilt compared to the first tilt (P = 0.041, paired Students t‐test). Connected points represent a single participant's responses. Mean response denoted by solid line. Box plots show median, maximum, minimum, first and third quartiles, and outliers.
