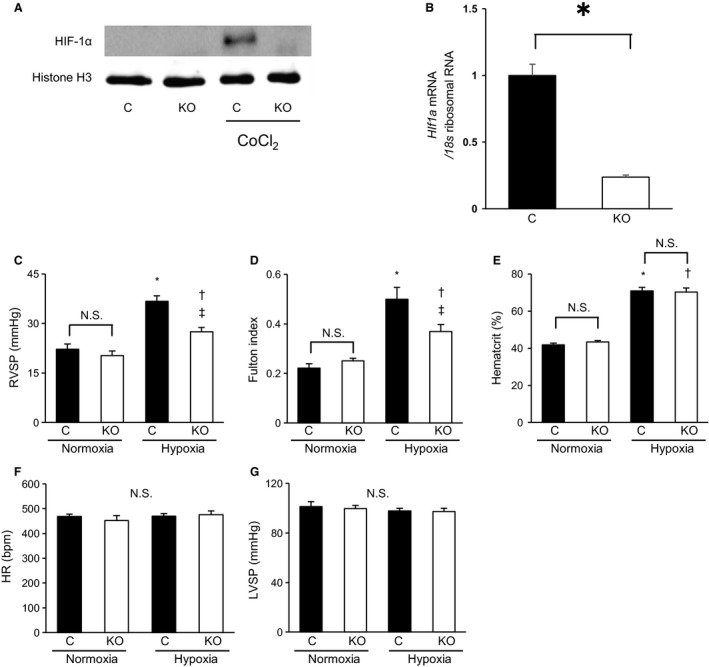
Figure 1.

The hypoxia‐induced RVSP elevation and right ventricular hypertrophy were suppressed by MyeHIF1KO. (A, B) Confirmation of myeloid‐specific HIF‐1α knockout by Western blot analysis and RT‐PCR. A, A representative image of HIF‐1α expression relative to Histon H3 expression by Western blot analysis is shown. Peritoneal macrophages (PMs) from control mice or MyeHIF1KO mice were used. Peritoneal macrophages were incubated with or without cobalt chloride (CoCl2, 100 μmol/L), a PHD inhibitor for 4 h, nuclear proteins were isolated and exmained by Western blot analysis. B, mRNA expression of HIF‐1α in PMs from control mice or MyeHIF1KO mice was examined by quantitaive RT‐PCR. Expression of HIF‐1α was normalized by that of 18s ribosomal RNA. n = 3. * P < 0.01. C–G, (C) right ventricular systolic pressure (RVSP), (D) Fulton index: right ventricular weight (RVW) standardized by the left ventricular and interventricular septum weight, (E) Hematocrit, (F) heart rate (HR), and (G) left ventricular systolic pressure (LVSP) of control mice or MyeHIF1KO mice in normoxia or hypoxia (10% O2 for 3 weeks) models. (C) n = 5 (C+normoxia), 6 (KO+normoxia), 8 (C+hypoxia), 8 (KO+hypoxia), (D) n = 7 (C+normoxia), 6 (KO+normoxia), 6 (C+hypoxia), 8 (KO+hypoxia), (E) n = 6 (C+normoxia), 6 (KO+normoxia), 6 (C+hypoxia), 8 (KO+hypoxia), (F) 5 (C+normoxia), 6 (KO+normoxia), 8 (C+hypoxia), 8 (KO+hypoxia), (G) n = 5 (C+normoxia), 6 (KO+normoxia), 5 (C+hypoxia), 4 (KO+hypoxia). * P < 0.05 versus control mice in normoxia. †P < 0.05 versus KO mice in normoxia. ‡ P < 0.05 versus control mice in hypoxia. C, control; KO, MyeHIF1KO; N.S. not significant
