Figure 4.

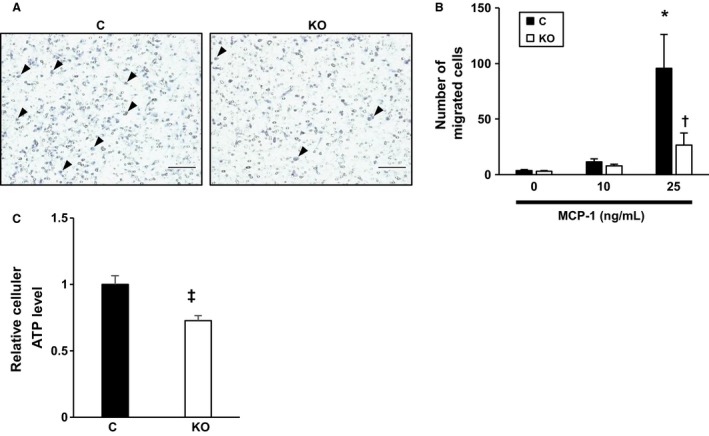
The attenuation of macrophage migration in HIF‐1α‐deficient mice. (A) Representative images of a macrophage chemotaxis assay induced by MCP‐1 (25 ng/mL) under hypoxic conditions (1% O2) for 16 h are shown. Scale bar is 100 μm. The arrowheads indicate migrated macrophages. (B) A quantitative analysis of the macrophage chemotaxis assay (n = 5) by MCP‐1 (0, 10, 25 ng/mL) under hypoxic conditions. Number of migrated cells per low‐power field was counted. (C) The intracellular ATP concentrations of macrophages under hypoxic conditions (1% O2) measured by a luciferase‐based chemiluminescent assay (n = 6) are shown. * P < 0.05 versus PMs derived from control mice with 0 ng/mL MCP‐1. † P < 0.05 versus PMs derived from control mice with 25 ng/mL MCP‐1. ‡ P < 0.05 versus PMs derived from control mice in normoxia. § P < 0.05 versus PMs derived from control mice in hypoxia. C, control; KO, MyeHIF1KO.
