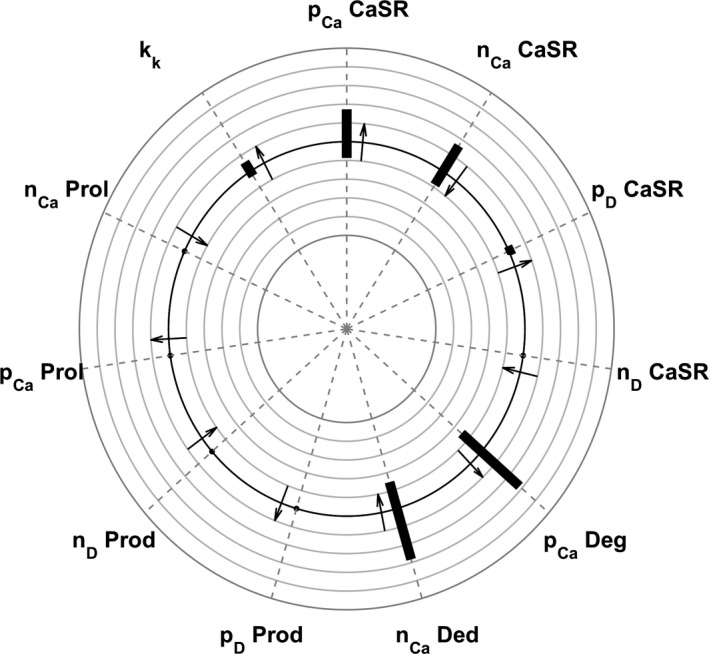
Figure 6.

Sensitivity plot of PTH predictions to changes in various parameters. The plot depicts the maximum deviation from reference PTH values as the ratio between the calculated PTH and the reference PTH. The smallest circle corresponds to a relative deviation of 0.5, the largest circle to a relative deviation of 1.5. Arrows pointing outward indicate that higher parameter values lead to higher PTH values; arrows pointing inward indicate that higher parameter values lead to smaller PTH values.
