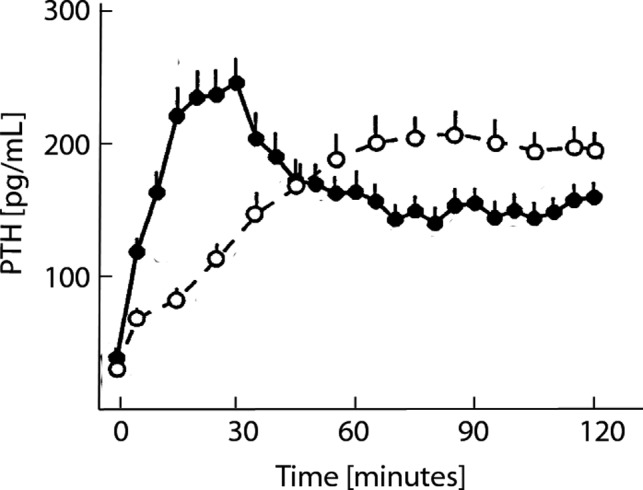
Figure 7.

Experimental data reported in Estepa et al. (1999), Figure 2B (adjusted and reproduced with permission of Kidney International). Ionized calcium concentrations were reduced by 0.4 mmol/L either in 30 min followed by a 90‐min hypocalcemic clamp (fast reduction, solid dots) or in 120 min (slow reduction, open dots). The fast Ca2+ reduction leads to a prominent peak in PTH levels. However, PTH levels during the hypocalcemic clamp following the fast reduction were significantly lower than PTH levels in the slow induction group.
