Figure 11.

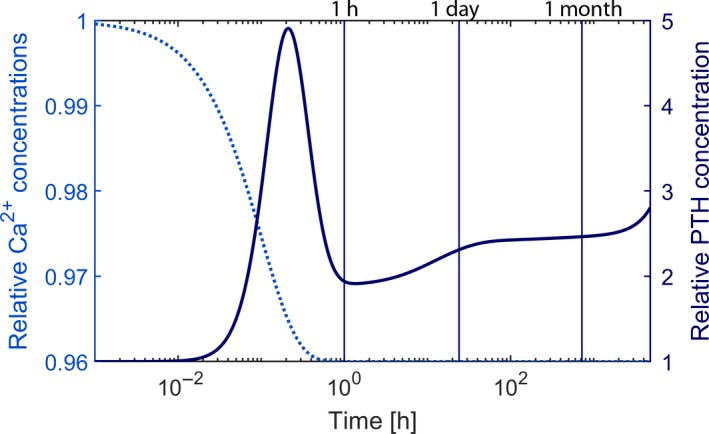
Time versus prescribed Ca2+ (dotted line) and predicted PTH (solid line) concentrations during simulated induced chronic hypocalcemia. The timescale is logarithmic; the black vertical lines indicate 1 h, 1 day, and 1 month.

Time versus prescribed Ca2+ (dotted line) and predicted PTH (solid line) concentrations during simulated induced chronic hypocalcemia. The timescale is logarithmic; the black vertical lines indicate 1 h, 1 day, and 1 month.