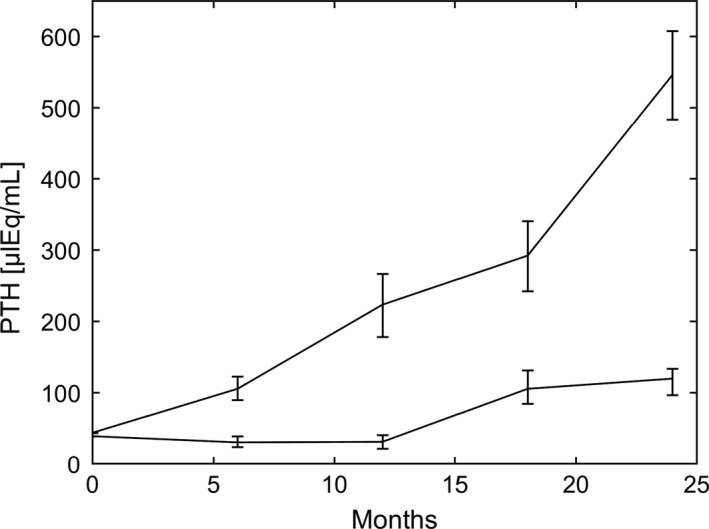
Figure 12.

PTH (mean and range) as a function if time reported in Rutherford et al. (1977), Figure 5. Adapted and reproduced with the permission of the Journal of Clinical Investigation. PTH was reported every 6 months. The slope of increase was significantly lower if phosphate intake was reduced according to the fall in glomerular filtration rate.
