Fig. 4.
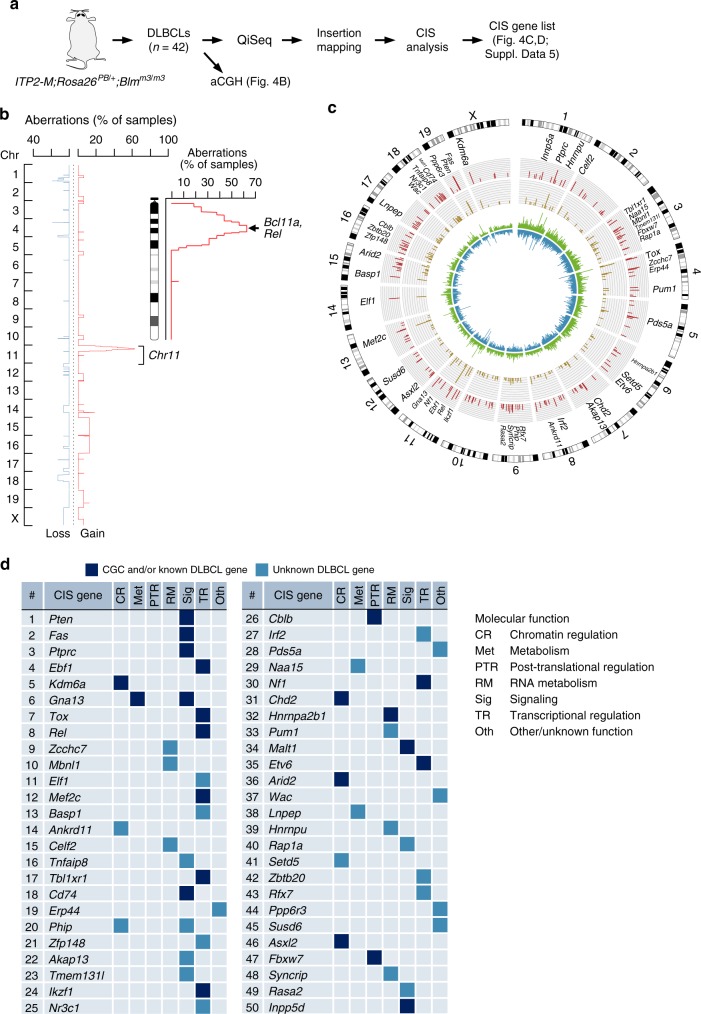
Genetic analysis of DLBCLs. a Scheme of experimental and analytic workflow. b Overlay of copy number profiles showing cancer-relevant amplifications/deletions in 16 DLBCLs from ITP2-M;Rosa26PB/+;Blmm3/m3 (IPB) mice. A zoomed-in view is provided for Chr11, which harbors frequent amplifications (identified in mouse GCB as well as ABC DLBCLs). The minimal amplified region contains—among other genes—the known DLBCL oncogenes Bcl11a and Rel. c Circos plot visualizing transposon insertion data from 42 IPB-DLBCLs. Rings from inward to outward: Insertion density plot for both orientations (shown in blue and green), number of insertions per common insertion site (CIS; dark yellow bars; axis from 0 to 140), number of contributing samples per CIS (red bars; axis from 0 to 40). Top 50 CIS genes are annotated. d Top 50 CIS genes ranked by number of contributing DLBCL samples. Molecular function (determined by literature search) of CIS genes is indicated. Transcription factors constituted the largest functional gene class (n = 15). Compared to the total number of mouse transcription factors (n = 1603), the enrichment for transcription factors among the top 50 CIS genes is highly significant (p = 1.4 10−5, Fisher’s exact test). Genes present in Cancer Gene Census (CGC) database and/or known for their role in DLBCL (literature search) are represented in dark blue, unknown DLBCL genes by light blue boxes. QiSeq quantitative transposon insertion site sequencing, aCGH array comparative genomic hybridization

