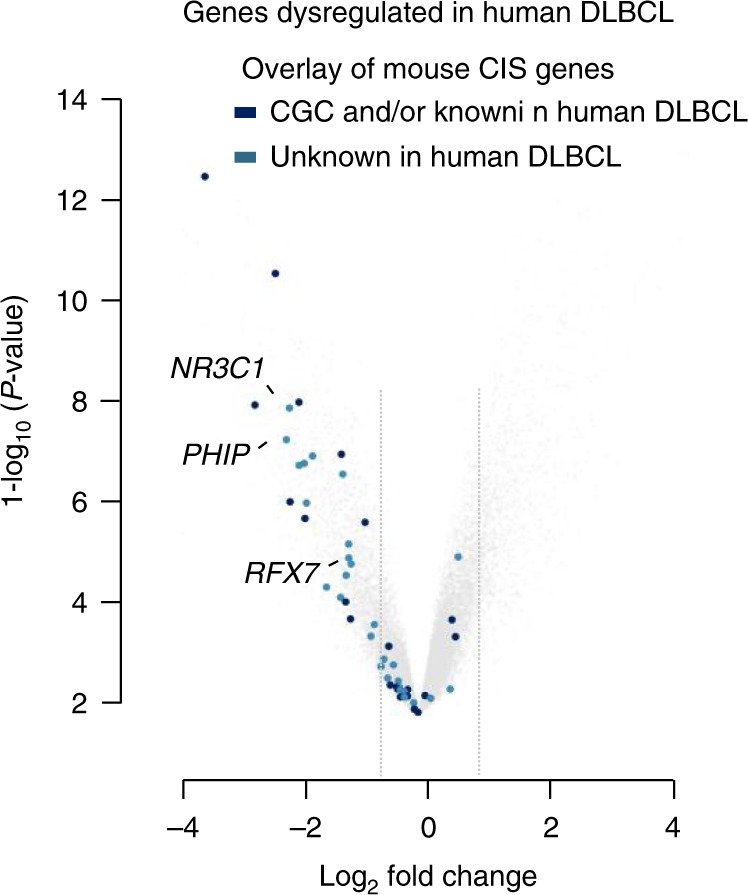
Fig. 5.

CIS genes are significantly downregulated in human DLBCL. Volcano plot shows negatively (left) and positively (right) regulated genes in human DLBCL samples relative to non-malignant B cells (centroblasts) (GSE12453). Gray lines indicate log2 fold changes of −0.8 and 0.8. Dark blue colored points represent human orthologues of genes from the top 50 CIS list that are included in the Cancer Gene Census (CGC) database and/or have already implicated roles in DLBCL. Light blue colored points depict candidate genes with unknown function in DLBCL
