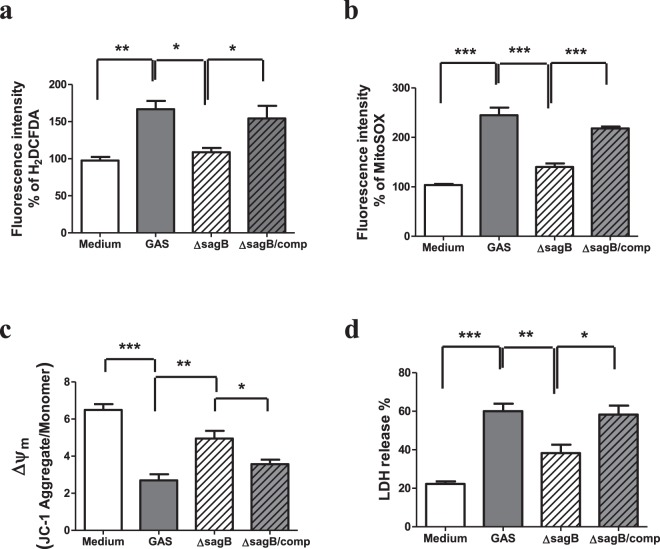
Figure 5.
The sagB mutation decreased mitochondrial ROS production and prevented mitochondrial dysfunction and cell death in the GAS-infected RAW264.7 cells. RAW264.7 cells were infected with the wild type GAS, isogenic sagB mutant or sagB- complementary mutant at a MOI of 25 as described in Materials and Methods. (a) The levels of ROS were measured by carboxy-H2DCFDA at 1 h post GAS infection, as described in Materials and Methods. Results are represented as mean ± SD. **P < 0.01 compared with medium only group. *P < 0.05 compared with sagB mutant group versus GAS group or versus sagB-complementary group (One-way ANOVA test followed by Tukey’s test; n = 4). Mitochondrial ROS levels and Δψm were measured by MitoSOX (b) and JC-1 (c) at 3 h post-infection respectively, as described in Materials and Methods. Results are represented as mean ± SD. In (b), ***P < 0.001 compared with GAS-infected group versus medium only group. ***P < 0.001 compared with sagB mutant group versus GAS group or versus sagB-complementary group (One-way ANOVA test followed by Tukey’s test; n = 4). In (c), ***P < 0.001 compared with GAS-infected group versus medium only group. **P < 0.01 compared with sagB mutant group versus GAS group. *P < 0.05 compared with sagB mutant group versus sagB-complementary group (One-way ANOVA test followed by Tukey’s test; n = 4). (d) The cell death of the wild type, the isogenic sagB mutant or sagB-complementary mutant-infected cells were determined by LDH release at 18 h post-infection. ***P < 0.001 compared with GAS-infected group versus medium only group. **P < 0.01 compared with sagB mutant group versus GAS group. *P < 0.05 compared with sagB mutant group versus sagB-complementary group (One-way ANOVA test followed by Tukey’s test; n = 4).

