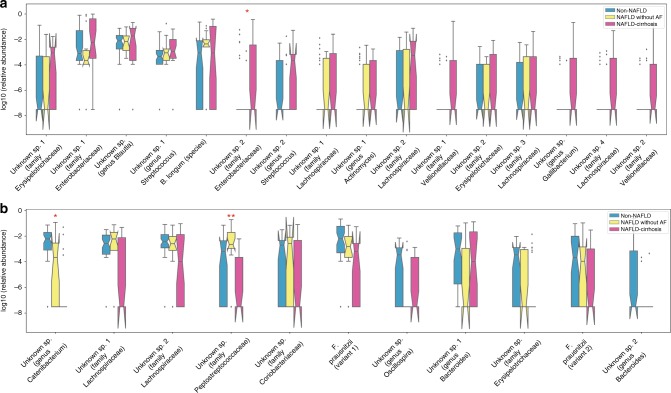
Fig. 3.
Relative abundance of predictive microbial features for the prediction of NAFLD-cirrhosis. The bacterial features most predictive of NAFLD-cirrhosis (n = 25) versus non-NAFLD controls (n = 51) sorted by decreasing importance score in Random Forest classification model. Features increased (a) and decreased (b) in NAFLD-cirrhosis probands are shown. Relative abundance is plotted for each subject group in the cohort (NAFLD-cirrhosis in pink (n = 25), NAFLD without advanced fibrosis in yellow (n = 17) and non-NAFLD controls in blue (n = 51)). The feature table is normalized to a total abundance of 1 per sample and relative abundances are plotted on a log10 scale. Each bacterial feature is a unique 16S tag sequence labeled to the highest possible taxonomic rank assigned using QIIME. The box plots show the quartiles and whiskers show the rest of the distribution (1.5 inter-quartile range). The notches show 95% confidence interval. Features that are differentially abundant in addition to being important predictors are marked by asterisk. Single asterisk (*) represents significant difference between non-NAFLD controls and NAFLD-cirrhosis probands p value < 0.05; Double asterisk (**) represents the same between NAFLD without advanced fibrosis and NAFLD cirrhosis probands p value < 0.05. Differential abundance was tested using permutation-based, ranked mean test, comparing mean difference between the two groups63. FDR (<0.1) was controlled using DS-FDR method64. Source data are provided as a Source Data file

