Fig. 4.
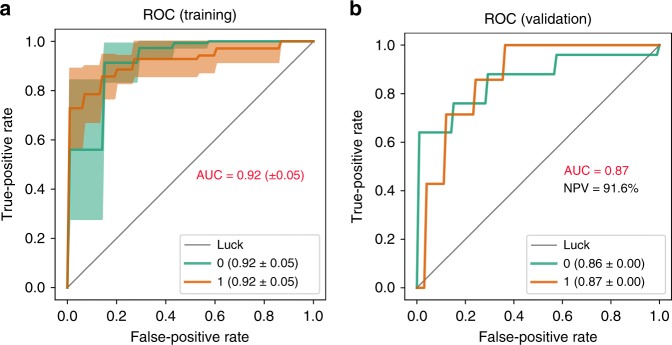
High diagnostic accuracy of a gut-microbiome signature for the detection of NAFLD-cirrhosis. Receiver operating characteristic (ROC) curves evaluating ability to predict advanced Fibrosis using Random Forest classification. Each curve represents the sensitivity and specificity to distinguish subjects with NAFLD-cirrhosis (1, brown line) from non-NALFD controls (0, green line). a Mean ROC curve from cross-validation within training data comprised of NAFLD-cirrhosis probands (n = 24) and non-NAFLD controls (n = 47). Cross-validation was performed by iteratively (10 times) training the Random Forest model with 70:30 train/test split on this training data. b ROC curve representing diagnostic accuracy of Random Forest classification model tested on first-degree relatives of NAFLD-cirrhosis probands (n = 32). The negative predictive value (NPV) of the model was 91.6% and the positive predictive value was 62.5%. Source data are provided as a Source Data file

