Fig. 1.
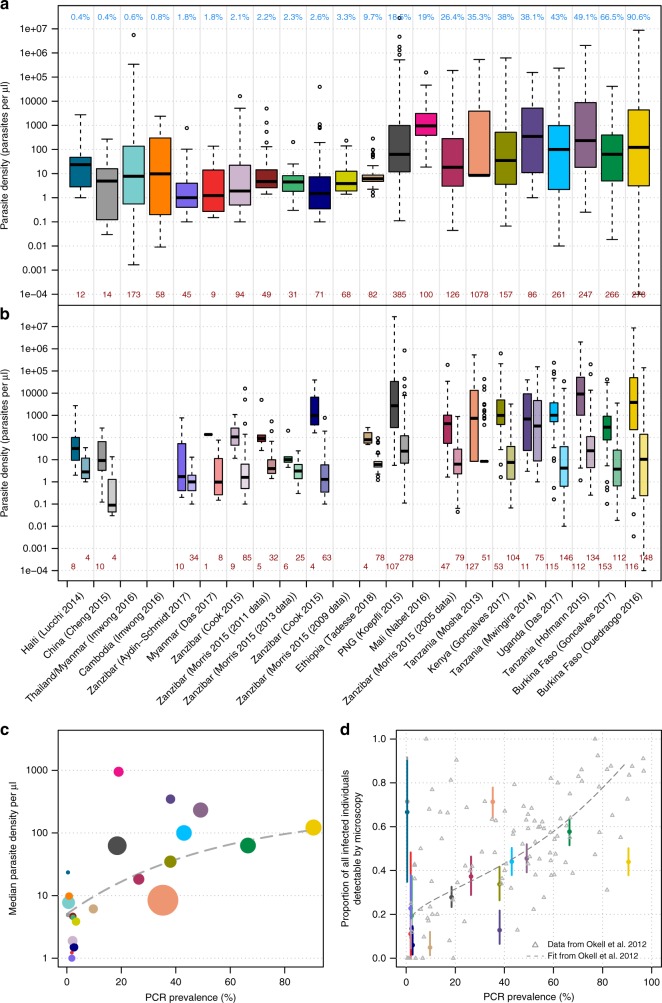
Parasite densities and detectability of asymptomatically infected individuals. a Boxplot of the parasite densities (parasites per µl) of all infected individuals by quantitative PCR or nucleic method. The blue numbers along the top indicate the PCR prevalence in each setting and the studies are ordered from left to right by prevalence. The dark red numbers along the bottom indicate the number of PCR-positive individuals in each study. The location and first author of each study is presented at the bottom of panel b. b The individuals in each study are separated in to two groups—those detectable by PCR and RDT/microscopy (darker shade on the left in each column) and those only detectable by PCR (lighter shade on the right). The dark red numbers along the bottom indicate the number of infected individuals in each group. For both boxplots, the centre line indicates the median, the upper and lower bounds of the box show the 25% and 75% percentiles, and the whiskers show the minimum and maximum values of each dataset. c The median parasite density in each study (also shown as the centre lines in the boxplots in panel a plotted against PCR prevalence. The fitted line is of the form: mean parasite density per µl = a – b*exp(m*PCR prevalence) where a = 2.342, b = 1.637, m = −1.896. The size of each circle is proportional to the number of PCR-positive samples in each study (shown at the bottom of panel a). d The proportion of PCR-positive individuals that are also detected by microscopy/RDT and 95% binomial confidence intervals. These are compared to a previously published relationship1, shown by the grey dashed line. The colours of the points correspond to the studies in panels 1a, b. Source data are provided as a Source Data file

