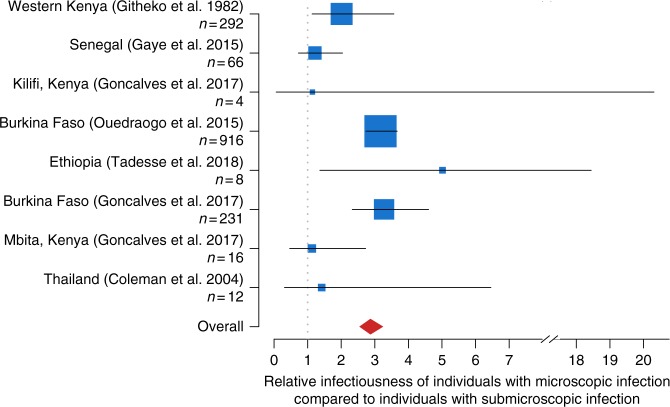
Fig. 8.
Relative infectiousness of submicroscopically infected individuals. Relative infectiousness of individuals with microscopy detectable infection compared to individuals with subpatent infection. The location of the blue box shows the mean, the size of the blue box indicates the number of infected vectors in the study (also shown in the y-axis labels). The horizontal lines indicate the 95% confidence intervals and the red diamond shows the pooled mean. Studies are listed in order of prevalence by microscopy, from highest at the top to lowest at the bottom. Data from each study are weighted to account for differences in expected biting frequency based on age (due to body size and probability of using a bednet) and age groups are weighted to ensure a consistent age distribution of individuals in all studies. Source data are provided as a Source Data file

