Figure 1.
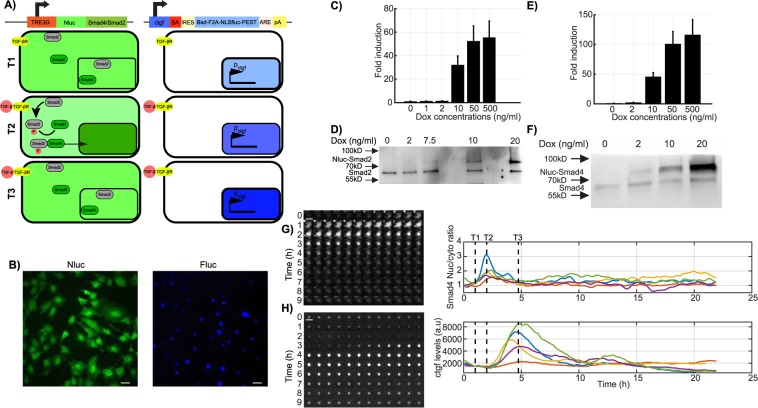
Dual bioluminescence reporter system. (A) Schematic illustration of the dual bioluminescent reporter system. Nanoluciferase (Nluc) was fused to Smad4 and expressed under the control of the TRE3G doxycycline promoter (left). A short-lived NLS-luciferase is integrated into the endogenous ctgf locus (right21). Bsd: Blasticidin-deaminase; F2A: foot-and-mouth virus co-translationally cleaved peptide; NLS: Nuclear localization signal; Fluc: firefly luciferase; PEST: protein destabilizing sequence. In unstimulated condition, SMAD4 is localized both in the nucleus and cytoplasm in the uninduced conditions and ctgf is expressed at a basal level. TGF-β stimulation, indicated with T1, results in a transient nuclear enrichment of SMAD4 signal while the Fluc signal increases. T2 and T3 represent the time points after TGF-β stimulation at which the average nuclear SMAD localization and the ctgf response reach their maxima, respectively. (B) Dual bioluminescence detection of NLuc-SMAD4 and ctgf levels (Fluc) in NIH-3T3 cells. Image shows one frame obtained from luminescence movies with Nluc and Fluc signals shown in green and blue, respectively. (C) Fold-change of Nluc-SMAD2 expression (luminescence) with different doses of doxycycline measured at steady-state (24 h after induction). (D) Western blotting analysis of Nluc-SMAD2 and SMAD2 expression with different doses of doxycycline. The cropped blot is used in the figure and the full length Western blot scans for the cropped images are shown in Supplementary Fig. 5. (E) Fold-change of Nluc-SMAD4 expression (luminescence) with different doses of doxycycline measured at steady-state (24 h after induction). (F) Western blotting analysis of Nluc-SMAD4 and SMAD4 expression with different doses of doxycycline. The cropped blot is used in the figure and the full length Western blot scans for the cropped images are shown in Supplementary Fig. 5. (G,H) Time series images of a tracked single cell expressing Nluc-SMAD4 on both Nluc (G) and Fluc (H) channels in the luminescence microscopy. Time goes from top left to bottom right, with a time resolution of 5 minutes. T1, T2 and T3: timing of TGF-β stimulation, SMAD translocation and ctgf expression peak, respectively. (A) Single-cell quantification of SMAD4 translocation (upper right panel) and ctgf expression level (lower right panel) profiles in five individual cells stimulated with TGF-β (5 nM) at time T1. Scale bar: 20 μm. Error bars: mean ± SD; n = 3.

