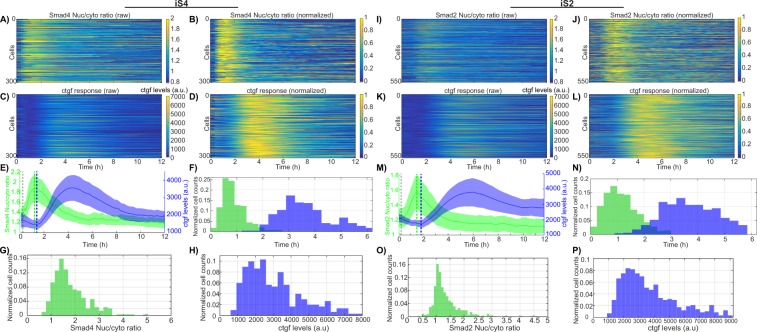
Figure 2.
Single cell variability of SMAD4/2 translocation dynamics and ctgf expression. (A–D) and (I–L) Heatmaps of single cell SMAD4/2 translocation (A,B,I,J) and ctgf expression (C,D,K,L) upon 5 nM TGF-β stimulation. Data is represented both in absolute luminescence levels (A,C and I,K) and intensities normalized on the maximal intensity for each trace (B,D,J,L). (E,M) Population average of SMAD4/2 translocation and ctgf expression. Vertical dashed lines: timing of the stimulation (black), SMAD translocation peak (green) and ctgf expression response initiation (blue). The latter two time points are manually annotated in single cell traces and averages of the population are indicated with dashed lines. (F,N) Single cell distribution of peak timing for SMAD4/2 translocation (green) and ctgf expression (blue). SMAD4: Mean = 55 min, CV = 0.33; SMAD2: Mean = 66 min, CV = 0.35. (G,O) Single-cell distribution of nuclear to cytoplasmic ratio at translocation peak for SMAD4 (G) and SMAD2 (O). (H,P) Single-cell distribution of ctgf expression peak levels for iS4 (H) and iS2 (P) cell lines.

