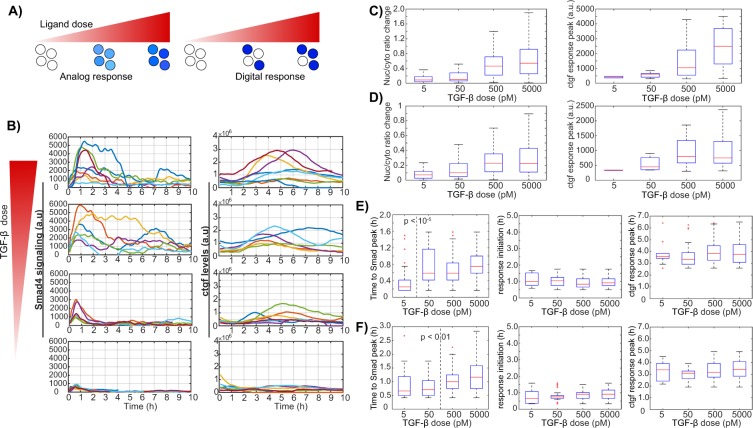
Figure 4.
Analog encoding of TGF-β dose information by dose-dependent SMAD signaling and ctgf responses. (A) Schematics of analog and digital responses of individual cells. White filled circles represent the unresponsive single-cells while blue shades represent the response strength. (B) Stimulation dose-response of TGF-β-induced SMAD4 signaling and ctgf response in single cells. At time t = 0, cells were treated with the indicated concentrations of TGF-β and representative traces for active single cells are shown. Left: traces of nuclear to cytoplasmic signal difference in SMAD4; right: ctgf responses in the corresponding single cells. (C,D) Nuclear/cytoplasmic ratio change from stimulation to the peak and ctgf response peak upon treatment with different doses of TGF-β in the iS4 (C) and iS2 (D) cell lines. (E,F) Time lag between TGF-β stimulation and peak of nuclear/cytoplasmic SMAD4/2 ratio (left), between TGF-β stimulation and ctgf response initiation (middle) and peak (right), in the iS4 (E) and iS2 (F) cell lines.

