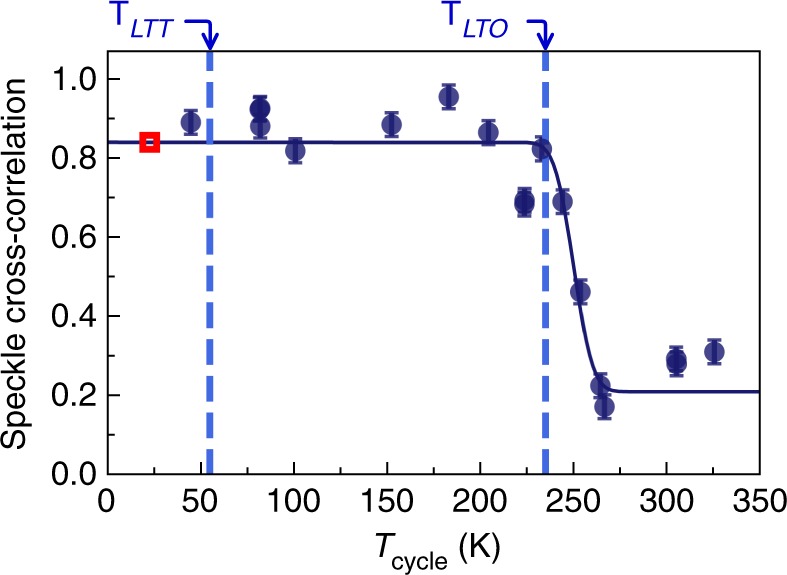
Fig. 4.

CDW memory. Normalized speckle cross-correlation coefficient, ξ, of data before and after temperature cycling to different values of Tcycle. Images of 200 × 200 detector pixels were used for this calculation. An error function fit gives a de-correlation onset temperature of 240(3) K, which coincides with the LTO structural phase transition. The red box indicates 24 K the temperature where all the speckle images were sampled for this figure. Error bars are estimated by taking the standard deviation of repeated, nominally equivalent, measurements
