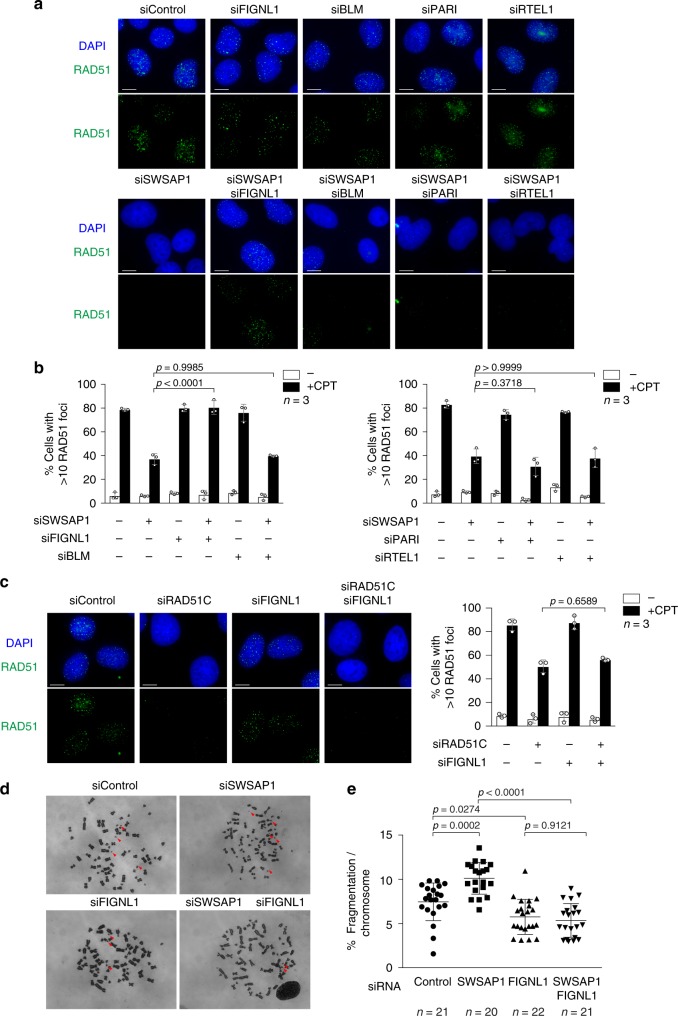
Fig. 3.
FIGNL1 depletion suppresses RAD51-focus formation defect in SWSAP1-deficient cells. a Representative images of RAD51 immunofluorescence staining in siRNA-transfected U2OS cells. After 96-h transfection of various combinations of siRNA for anti-recombinases (FIGNL1, BLM, PARI, RTEL1) with siRNA with or without siRNA against SWSAP1, cells were treated with 100 nM of CPT for 22 h and immuno-stained for RAD51. Bar 10 µm. b Quantification of RAD51-positive cells in a was analyzed described in Fig. 1f. Data are mean ± s.d. (n = 3, three biological independent). Statistical significance was measured by Mann–Whitney’s U-test. Statistics and reproducibility; see accompanying Source data. c Left; Representative images of RAD51 immunofluorescence staining in siRNA-transfected U2OS cells for FIGNL1 and or RAD51C. Right; Quantification of RAD51-positive cells in RAD51C- and FIGNL1-depleted cells was done as described in Fig. 1f. Bar 10 µm. Data are mean ± s.d.; Statistics and reproducibility, see accompanying Source data. d Representative images of metaphase chromosomes in siRNA-transfected cells. U2OS cells transfected with or without siRNA for SWSAP1 and or FIGNL1 for 96 h. Cells were arrested at metaphase by the treatment of colcemid for 2 h and chromosome spreads were prepared and Giemsa-stained. e Quantification of fragmented chromosomes in indicated siRNA-transfected cells. Percentages of fragmented chromosomes (shown by arrows) per a nuclear spread were calculated by dividing a number of fragmented chromosomes by a total number of chromosomes in a nucleus. More than 20 nuclei in each siRNA-treated cells were analyzed. Bar 10 µm. Data are mean ± s.d. Statistical significance was measured by Mann–Whitney’s U-test. Statistics and reproducibility; see accompanying Source Data

