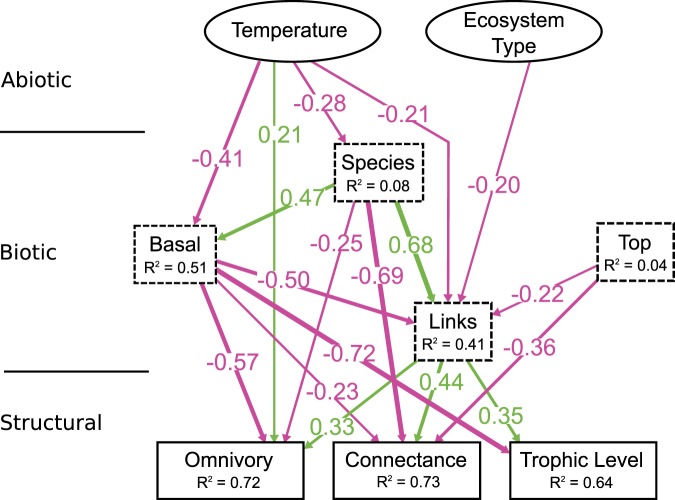
Figure 2.
Standardized effects for the most parsimonious model (temperature only). For simplicity, only direct effects are shown, but indirect effects are depicted in Fig. 2. Abiotic factors (temperature, ecosystem type) depicted as solid ellipses, biotic factors (proportion of basal and top species, the number of species and links) as dashed rectangles, and measures of food web network structure (omnivory, connectance and maximum trophic level) as solid rectangles. Only significant effects are reported. Explained variance for each response variable is indicated as R2 values and all relevant statistics for these models can be found in Table 1. Pink arrows indicate negative effects while green arrows indicate positive effects.

