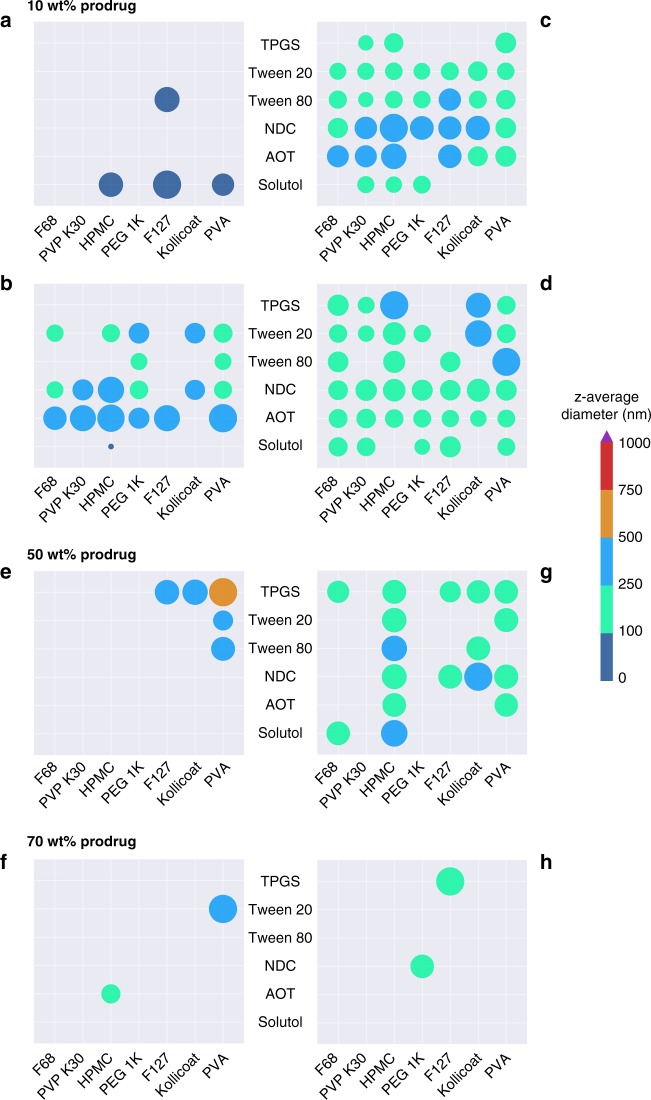
Fig. 4.
Overview of hits mapped onto binary excipient combinations. a–d Hits identified for prodrugs 2, 4, 6, and 8 respectively at 10 wt% drug loading relative to excipients, e, g impact on number of hits and z-average diameter after increased prodrug loading to 50 wt% for 4 and 8 respectively, and f, h impact on number of hits and z-average diameter after increased prodrug loading to 70 wt% for 4 and 8 respectively. Each colour represents a size range (as indicated by the legend) and circle diameter represents whether the z-average diameter value resides at the lower or higher end of the range

