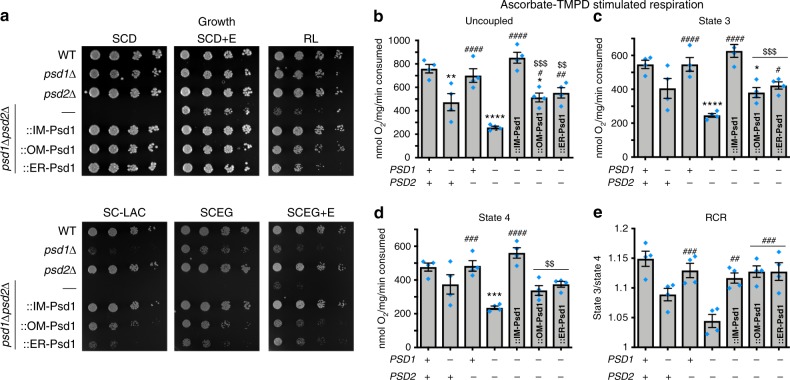
Fig. 4.
OM-Psd1 and ER-Psd1 OXPHOS function phenocopies psd1Δ. a The indicated strains were spotted and incubated at 30 °C for 2 days on SCD with or without (+/−) 2 mM ethanolamine (+E) and for 5 days on rich lactate (RL), SC lactate (SC-LAC), and SCEG with or without (+/−) 2 mM ethanolamine (+E). b–e O2 consumption measurements from mitochondria isolated from yeast grown in rich lactate using ascorbate-TMPD as a substrate. b The maximal respiratory rate was recorded after the addition of CCCP, (c) state 3 respiration was assessed after addition of ADP, and (d) state 4 respiration was recorded following ADP depletion. e The respiratory control ratio (RCR) is calculated by dividing state 3 by state 4 respiratory rates. Statistical comparisons (ns, P > 0.05; 1 symbol P ≤ 0.05; 2 symbols P ≤ 0.01; 3 symbols P ≤ 0.001; 4 symbols P ≤ 0.0001) vs. WT (asterisk), psd1Δpsd2Δ (number sign), or IM-Psd1 (dollar sign) were performed by one-way ANOVA with Tukey’s multiple comparison test (mean ± S.E.M. for n = 4 biologically independent experiments)

