Fig. 3.
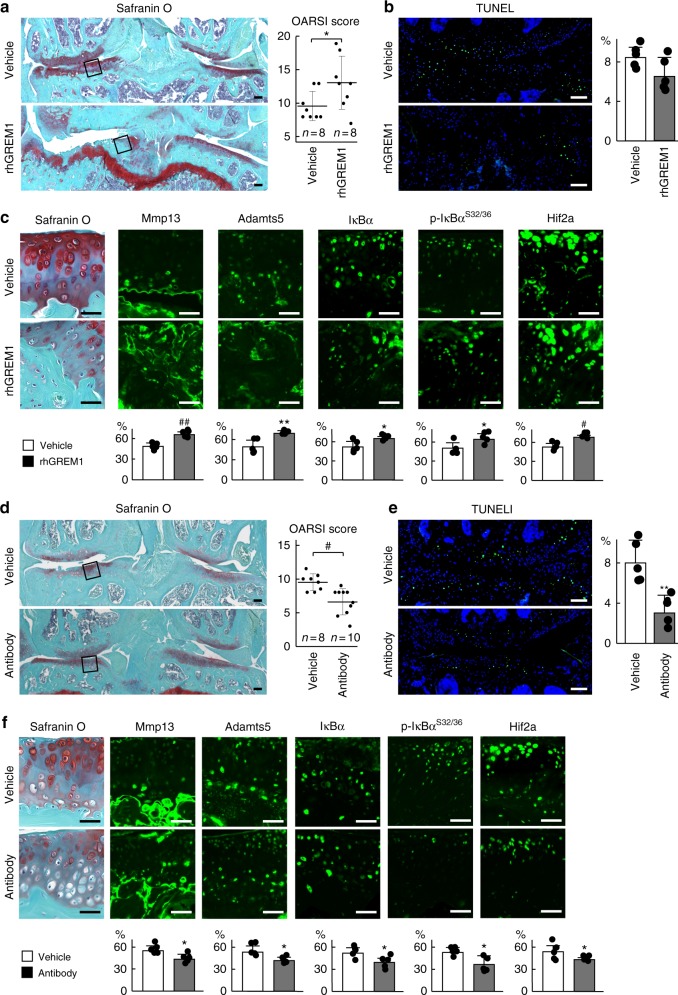
Effects of recombinant human gremlin-1 (rhGREM1) and gremlin-1 antibody in vivo. a Safranin O staining and OARSI scores of mouse knee joints after intra-articular administration (twice a week for 8 weeks) of 10 µL of 10 µg/mL rhGREM1 or vehicle. Both experimental groups consist of n = 8 biologically independent animals. Inset boxes indicate regions of immunofluorescence in (c). Scale bars, 100 µm. b TUNEL staining and rate of TUNEL-positive cells in mouse knee joints after intra-articular administration of rhGREM1 or vehicle. Nuclei were stained with DAPI (blue). Scale bars, 100 µm. n = 5 biologically independent experiments. c Safranin O staining and immunofluorescence of Mmp13, Adamts5, IκBα, phosphorylated IκBα (dual Ser32/36), and HIF-2α proteins in mouse knee joints after intra-articular administration of rhGREM1 or vehicle. Scale bars, 50 µm. The percentage of positive cells in the immunofluorescence is shown below. n = 5 biologically independent experiments. d Safranin O staining and OARSI scores of mouse knee joints after with intra-articular administration (twice a week for 8 weeks) of 10 µL of 10 µg/mL gremlin-1 antibody or vehicle. Both experimental groups consist of biologically independent animals: vehicle n = 8, antibody n = 10. Inset boxes indicate regions of immunofluorescence in (f). Scale bars, 100 µm. e TUNEL staining and rate of TUNEL-positive cells in mouse knee joints after intra-articular administration of gremlin-1 antibody or vehicle. Nuclei were stained with DAPI (blue). Scale bars, 100 µm. n = 5 biologically independent experiments. f Safranin O staining and immunofluorescence of Mmp13, Adamts5, IκBα, phosphorylated IκBα (dual Ser32/36), and HIF-2α proteins in mouse knee joints after intra-articular administration of gremlin-1 antibody or vehicle. Scale bars, 50 µm. The percentage of positive cells in the immunofluorescence is shown below. n = 5 biologically independent experiments. All data are expressed as mean ± SD. *P < 0.05, **P < 0.01, #P < 0.005, ##P < 0.001 versus vehicle (Student’s unpaired two-tailed t-test)

