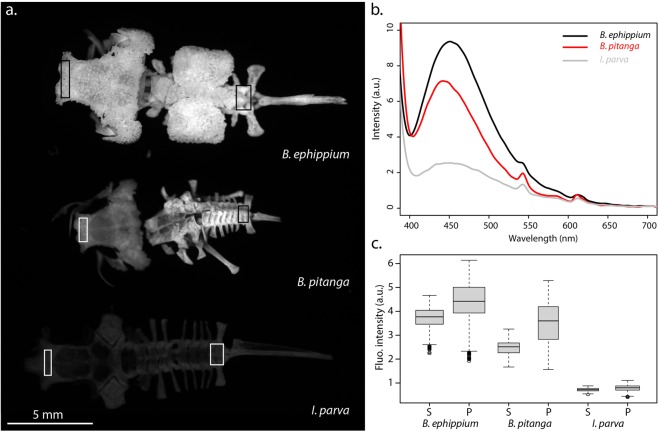
Figure 4.
Bone fluorescence in pumpkin toadlets. (a) Emission of bones of Brachycephalus ephippium, B. pitanga and Ischnocnema parva under UVA lighting (λexcitation = 365 nm) collected in the spectral range where their fluorescence occurs, using a 455–485 nm band-pass filter. The bones represented are the skull, spinal column and urostyle. All were imaged in a single shot to allow direct comparison of their emission intensities. (b) Emission spectra of the skull (1.5 mm diameter area) of the three species under UV lighting (λexcitation = 365 nm), in arbitrary units (a.u.). (c) Boxplots, corresponding to the boxes in (a), comparing fluorescence intensities (in terms of grey-level of single pixels) of the skull (S) and pelvic area (P) of one individual for each of the three species (B. ephippium: n = 1,760 pixels (S), n = 2,331 pixels (P); B. pitanga: n = 1,064 pixels (S), n = 943 pixels (P); I. parva: n = 1,054 pixels (S), n = 1,320 pixels (P)). The boxes represent the first and the third quartiles; the bold line the median; the whiskers the first and ninth deciles; and the points outliers. Quantitative indices are given in Table S1.

