Fig. 2.
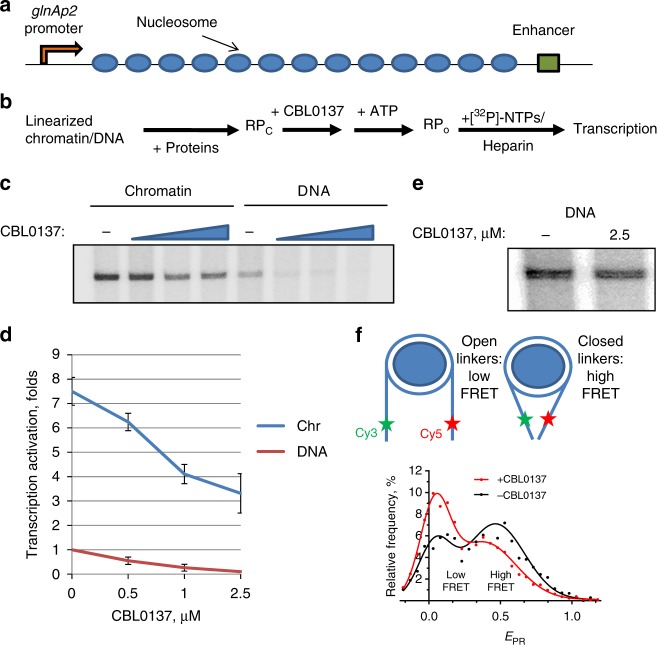
CBL0137 inhibits EPC in vitro. a A 13-nucleosome 601207 × 13 array for EPC rate analysis30, 33. b Experimental approach for the EPC rate analysis on DNA and chromatin30. After assembly of the corresponding DNA–protein complexes at the promoter and enhancer, the array was incubated with CBL0137, and EPC was initiated. The addition of labeled rNTPs with heparin allows transcript synthesis, prevents a second round of transcription, and eliminates the nucleosomal barrier for the transcribing RNA polymerase. c Transcription of the array in the presence of increasing CBL0137 concentrations (0.5, 1, and 2.5 µM). Analysis of labeled transcripts by denaturing PAGE. d Quantitative analysis of the 176-nt transcripts shown in c. Error bars represent the s.d. based on four independent measurements using two different reconstitutes. e Transcription of the DNA array having a short distance (708 bp) between the enhancer and promoter in the presence or absence of CBL0137. f CBL0137 affects the conformation of linker nucleosomal DNA. Top: Fluorescently labeled nucleosomes (asterisks mark positions of Cy3 and Cy5 labels) having 40-bp extending DNA linkers were incubated with or without CBL0137 (0.5 µM). Bottom: Typical frequency distributions of nucleosomes by proximity ratio (EPR) measured using spFRET microscopy. Experimental data (dots) were fitted with a sum of two Gaussians (solid lines). The sample sizes (n, single particle events) were: (+CBL0137) – 4310; (−CBL0137) – 2832. The mean values of EPR peak maxima and s.e.m. averaged over three independent experiments were: (+CBL0137) – 0.04 ± 0.01, 0.38 ± 0.04; (−CBL0137) – 0.04 ± 0.02, 0.47 ± 0.04. Source data of Fig. 2c–f are provided in a Source Data file

