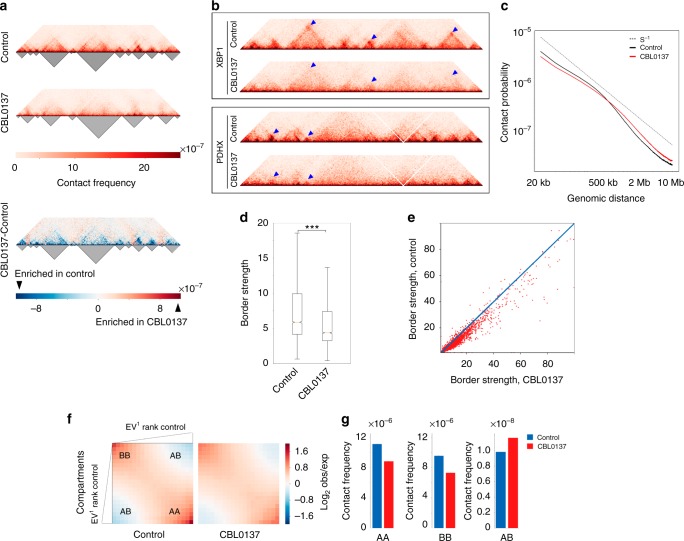
Fig. 3.
CBL0137 disturbs higher-order chromatin packaging. a HiC-map (heatmap) for a representative 10 Mb segment of chromosome 8 from control (upper panel) or CBL0137-treated HT1080 cells (middle panel). Heatmaps were normalized by the total number of sequencing reads, binned at a 20 kb resolution and iteratively corrected. TADs were annotated using the Lavaburst package (dark triangles below heatmaps). The heatmap in the lower panel shows the interactions enriched or depleted in CBL0137-treated cells compared to control cells. b Heatmaps showing the effect of CBL0137 on distant chromatin interaction patterns within the 4 Mb-long genomic segments centered at genes XBP1 (upper panel) and PDHX (lower panel). Note the partial disruption of the TADs, and the decrease in the intensities of signals arising because of chromatin looping (blue triangles) in CBL0137-treated cells. c Scale plots showing the dependency of contact probability on genomic distance in control (black line) and CBL0137-treated (red line) cells. The dotted line indicates the contact probability P(s) = s−1. d Box plots demonstrating the significant (P-value = 3.47 × 10⁻⁵, N = 4862, t-test) decrease in the TAD border strength caused by CBL0137 treatment. Horizontal lines represent the median; upper and lower ends of boxplot show the upper and lower quartiles, the whiskers indicate the upper and lower fences. e Scatter plot demonstrating the value of TAD border strength in control and CBL0137-treated cells for each of the TAD borders annotated in the control cells. The location of most of the experimental points below the diagonal shows that the strength of the major part of the TAD borders decreased as a result of CBL0137 treatment. f Saddle plots displaying the extent of compartmentalization genome-wide in control and CBL0137-treated cells. g Frequencies of distant contacts within and between the A and B compartments in control and CBL0137-treated cells. Source data of Fig. 3c–e are provided in a Source Data file

