Fig. 5.
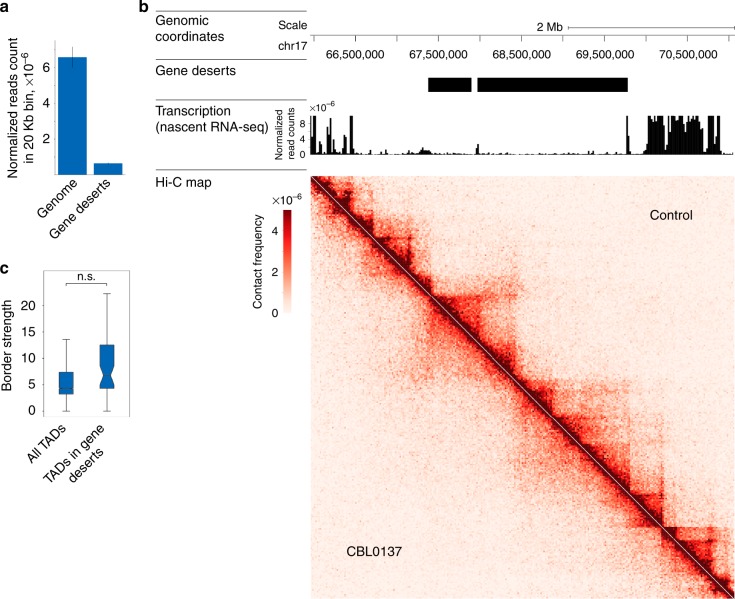
Effects of CBL0137 on spatial genome organization do not depend on transcription. a Bar plot shows the RNA normalized read count in a 20 kb-long bin calculated from nascent RNA-sequencing data from HT1080 cells. The average data are presented for all genomic bins (“genome”) and bins located in gene deserts that we define as extended (> 500 kb) genomic regions lacking known genes. Error bars represent s.e.m. b Genomic segment from chromosome 17 containing a representative extended (~ 2 Mb) gene desert is shown. Corresponding genomic coordinates, mapped gene deserts, transcription levels (normalized reads count) across the region in intact HT1080 cells, and Hi-C maps for control and CBL0137-treated HT1080 cells are indicated. c Box plots showing no difference (P-value = 0.5137, t-test; n.s. – not significant) in the TAD border strength calculated for either all TADs mapped in CBL0137-treated HT1080 cells or TADs located in gene deserts. Horizontal lines represent the median; upper and lower ends of boxplot show the upper and lower quartiles, the whiskers indicate the upper and lower fences. Source data of Fig. 5a and c are provided in a Source Data file

