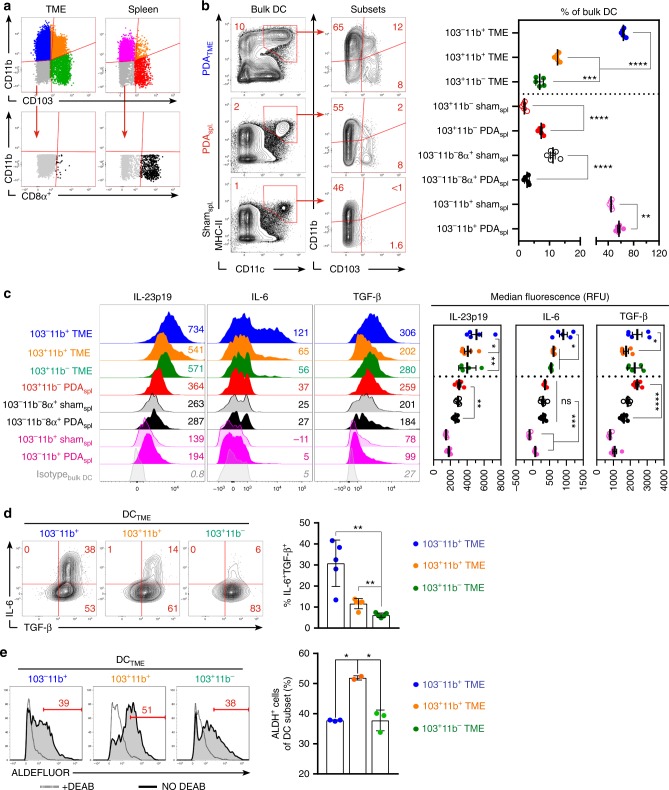
Fig. 3.
Specific subsets of PDATME dendritic cell (DC) exhibit distinct phenotypic properties. a The gating strategy for subset analysis of PDATME and spleen DC based on expression of CD11b, CD103, and CD8α is depicted. b Frequencies of PDATME and spleen DC subsets based on expression of CD11b, CD103, and CD8α were analyzed. Representative contour plots and quantitative results are shown. Experiments were repeated >5 times. c Histogram plots comparing cytokine expression in distinct DC subsets are shown. Numbers adjacent to histograms represent MFI ÷ 10. Quantitative data based on MFI are shown. Dotted-line separates PDATME DC from splenic DC controls. Experiments were repeated three times. d The frequency of IL-6 and TGF-β1 co-expression in PDATME DC subsets was tested. Representative contour plots and quantitative data are shown. This experiment was repeated three times. e Enzymatic activity of ALDH in PDATME DC subsets was determined by the ALDEFLUOR assay. Gates were determined by respective DEAB controls (dotted histogram) for each individual sample. This experiment was repeated three times (*p < 0.05, **p < 0.01, ***p < 0.001, ****p < 0.0001, t-test), SEM

