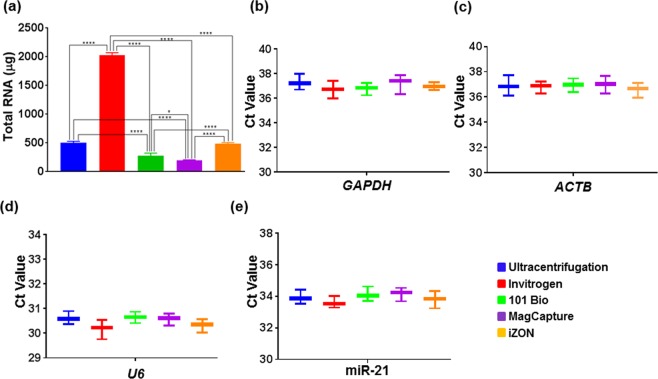
Figure 5.
RNA quantification and quantitative real-time PCR. (a) RNA was isolated from different exosomal preps using total exosome RNA isolation kit and quantified using nanodrop-1000. Differential RNA yield reflected different exosome quantity obtained from various procedures. (b) cDNA was prepared using 40 ng of RNA using specific RT primer for microRNA while Random primer were used for GAPDH and β-actin and expression of U6, miR-21, β-actin and GAPDH was examined by qRT-PCR. Ct values are plotted for each transcripts and data presented as mean ± s.d.; n = 3, p-values *≤0.0246, and ****<0.0001.

