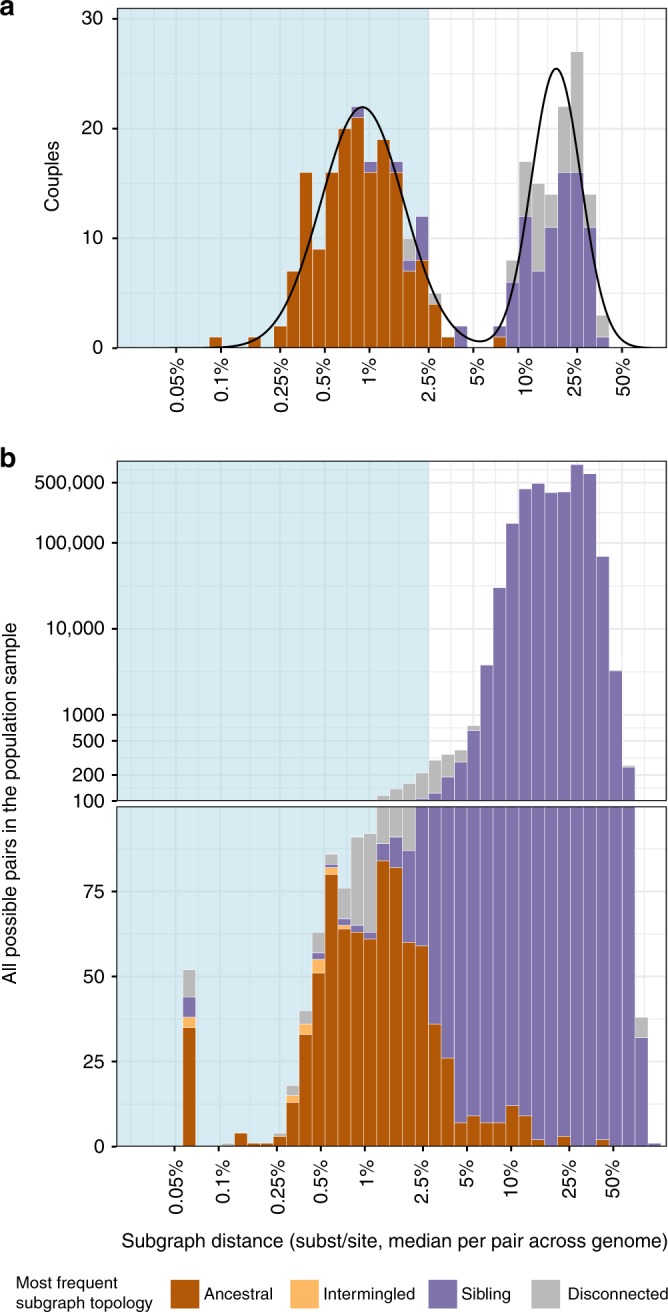
Fig. 3.

Deep-sequence phylogenetic data in the population-based sample. To highlight the characteristics of deep-sequence phylogenetic data in a population-based sample, we compared phylogenetic patterns among couples in whom both partners were positive to the patterns in the larger population-based sample. a Analysis of 331 couples. For each couple, their subgraph distances and subgraph topologies were calculated in each deep-sequence phylogeny across the genome as shown in Fig. 1d. Subgraph distances were standardized to the average evolutionary rate of the HIV-1 gag and polymerase genes (see Methods). Information from all deep-sequence phylogenies was summarized by median distance and the most frequent subgraph topology (colours). The distribution of median distances had a clear bimodal shape, separating couples into two groups that were either phylogenetically closely or distantly related. The distribution of median distances was well described by a two-component lognormal mixture model (black lines). 95% of couples in the first component had distances below 0.025 substitutions per site (light blue area) and 99% of couples in the first component had distances below 0.05 substitutions per site. We used these thresholds to classify couples into phylogenetically close and distant. 93.3% of phylogenetically close couples also had mostly ancestral subgraphs. b Analysis of 3,515,226 possible pairs in the population-based sample. For visualization purposes, smaller numbers are displayed on natural scale and larger numbers on log scale. The distribution of median distances was not bimodal, and subgraph distances did not clearly separate pairs of individuals into closely or distantly related pairs. 48/814 (5.9%) pairs with mostly ancestral subgraphs were phylogenetically distant as defined by the couples’ analysis. One hundred and eighteen phylogenetically close pairs had mostly intermingled or sibling subgraphs and were missed by subgraph ancestry, indicating that all types of subgraph topologies in combination with subgraph distance should be used for inference of population-level transmission networks
