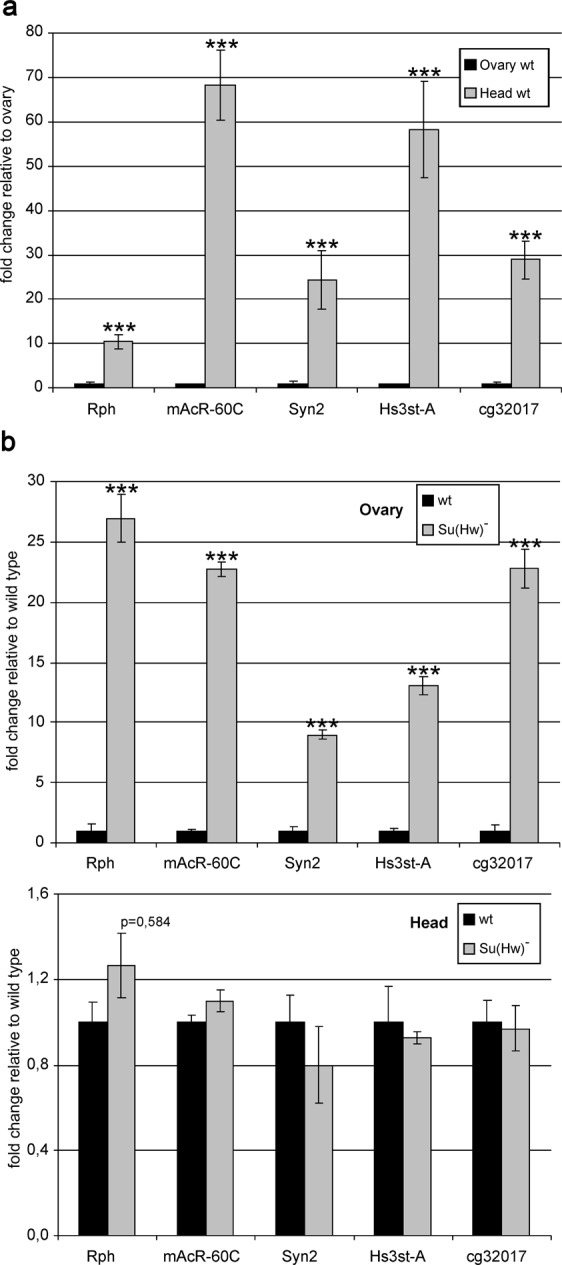
Figure 2.

Expression of model genes in the heads and ovaries of females. (a) Wild-type (wt) expression of genes, with mRNA levels in the heads shown as a fold change relative to those in the ovaries. (b) Expression of genes in the su(Hw)v/su(Hw)e04061 background (su(Hw)−), with mRNA levels shown as a fold change relative to the wild-type levels. Error bars indicate standard deviation of three independent biological replicates. Here and in Figs 3–5 and 7, mRNA levels are normalized to that of the ras64B gene, which remains unchanged in the su(Hw)− background.
