
Figure 5.
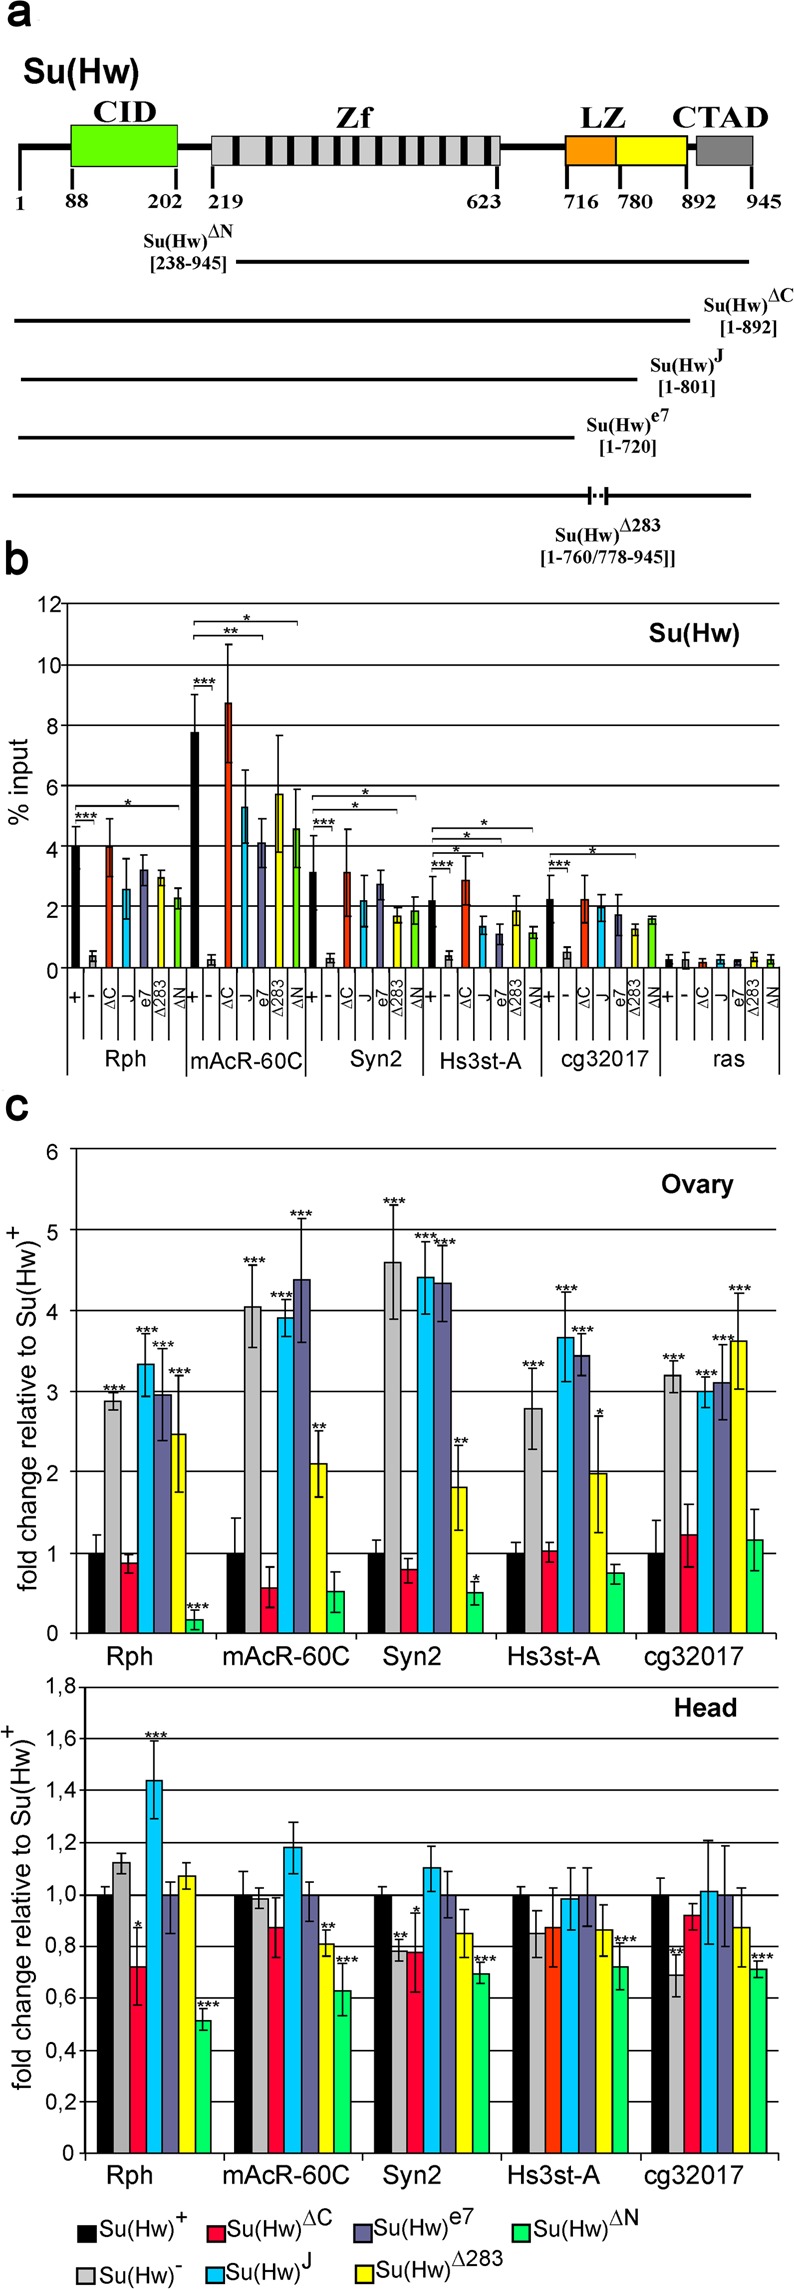
The C-terminal region (720–892 aa) of Su(Hw) is responsible for repression. (a) Structural scheme of the Su(Hw) protein, with the lines below representing its derivatives included in analysis. All designations are as in Fig. 4. (b) ChIP-qPCR data on Su(Hw) binding to the promoters of model genes in the transgenic lines Su(Hw)+ (+), Su(Hw)ΔC (ΔC), Su(Hw)ΔN (ΔN), Su(Hw)Δ283 (Δ283), Su(Hw)e7 (e7), Su(Hw)J (J), and Su(Hw)− – y2 w1118scD1ct6; su(Hw)v/su(Hw)e04061 background (−). Different variants of the Su(Hw) protein were expressed in the lines y2 w1118scD1ct6; P{Su(Hw)}-38D/P{Su(Hw)}-38D; su(Hw)v/su(Hw)e04061, where P{Su(Hw)} refers to Su(Hw)+ – P{w+;UbqW-Su(Hw)1–945-FLAG}; Su(Hw)ΔC – P{w+;UbqW-Su(Hw)1–892-FLAG}; Su(Hw)ΔN – P{w+;UbqW-Su(Hw)238–945-FLAG}; Su(Hw)Δ283 – P{w+;UbqW-Su(Hw)1–760/778–945-FLAG}; Su(Hw)e7 – P{w+;UbqW-Su(Hw)1–720-FLAG}; or Su(Hw)J – P{w+;UbqW-Su(Hw)1–801-FLAG}. The ras64B coding region (ras) was used as a control devoid of Su(Hw) binding sites. The percent recovery of immunoprecipitated DNA (Y axis) was calculated relative to the amount of input DNA. Error bars indicate standard deviation of three independent biological replicates. Statistical analysis was performed relative to Su(Hw) binding in the Su(Hw)+ line. Significance leves are shown for treatment comparisons indicated by horizontal brackets. (c) RT-qPCR data on the expression of model genes in the ovaries and heads in the Su(Hw) mutant backgrounds. Expression levels are shown as fold change relative to those in the Su(Hw)+ transgenic line. Error bars indicate standard deviation of three independent biological replicates.